
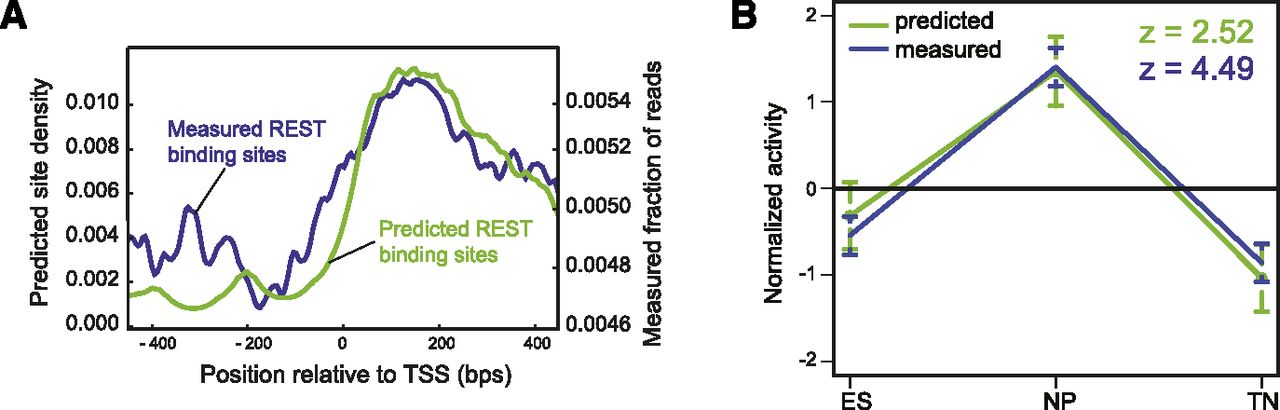
Figure 2.
Analysis of REST binding data supports computational predictions. (A) Frequency of predicted (green line) and measured (blue line) binding sites around TSSs. (B) REST activity profiles calculated by Epi-MARA are similar when using either computationally predicted (green line) or measured REST binding sites (blue line). The prediction has higher significance when using the measured sites as indicated by the higher z-value (i.e., higher variance in activity relative to the error bars).


