
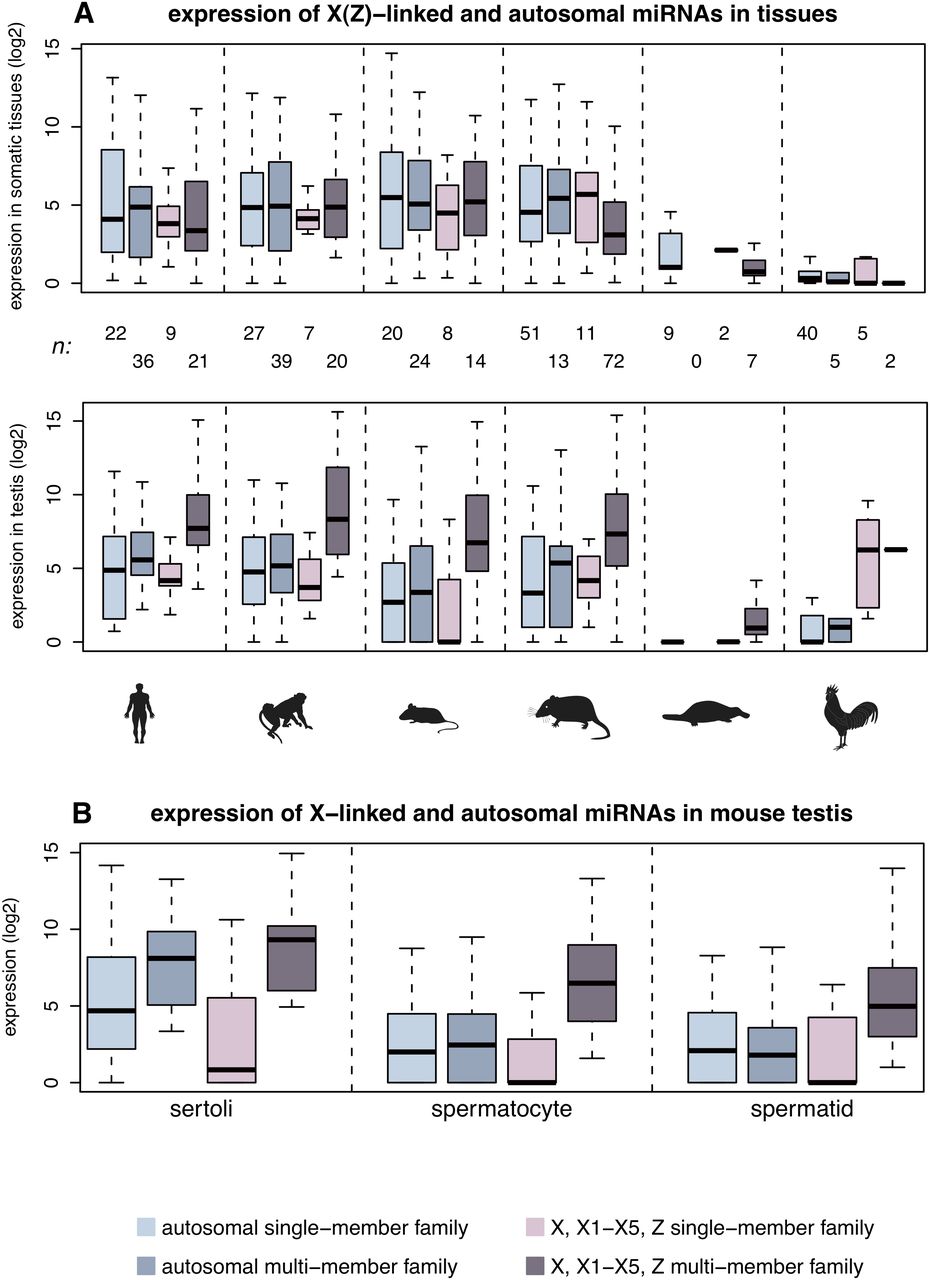
Expression patterns of sex chromosome-linked and autosomal miRNAs. (A) Spatial expression pattern of miRNA genes on the therian X, platypus X1–X5, and bird Z chromosomes. Expression level distributions of miRNA genes shared among and specific to eutherians, marsupials, monotremes, or specific to chicken (see Methods for miRNA age definitions) are shown. The sample size, n, corresponds to the number of independent expression values. Note that we define expression levels of miRNA genes in somatic tissues as their median expression levels across all four somatic tissues. Also, common expression values associated with two or more miRNA loci with highly similar mature sequences were divided by the number of loci involved. (B) Expression of miRNA genes shared among and specific to eutherians in mouse spermatogenic cells. Sample sizes are the same as indicated for mouse in panel A.


