
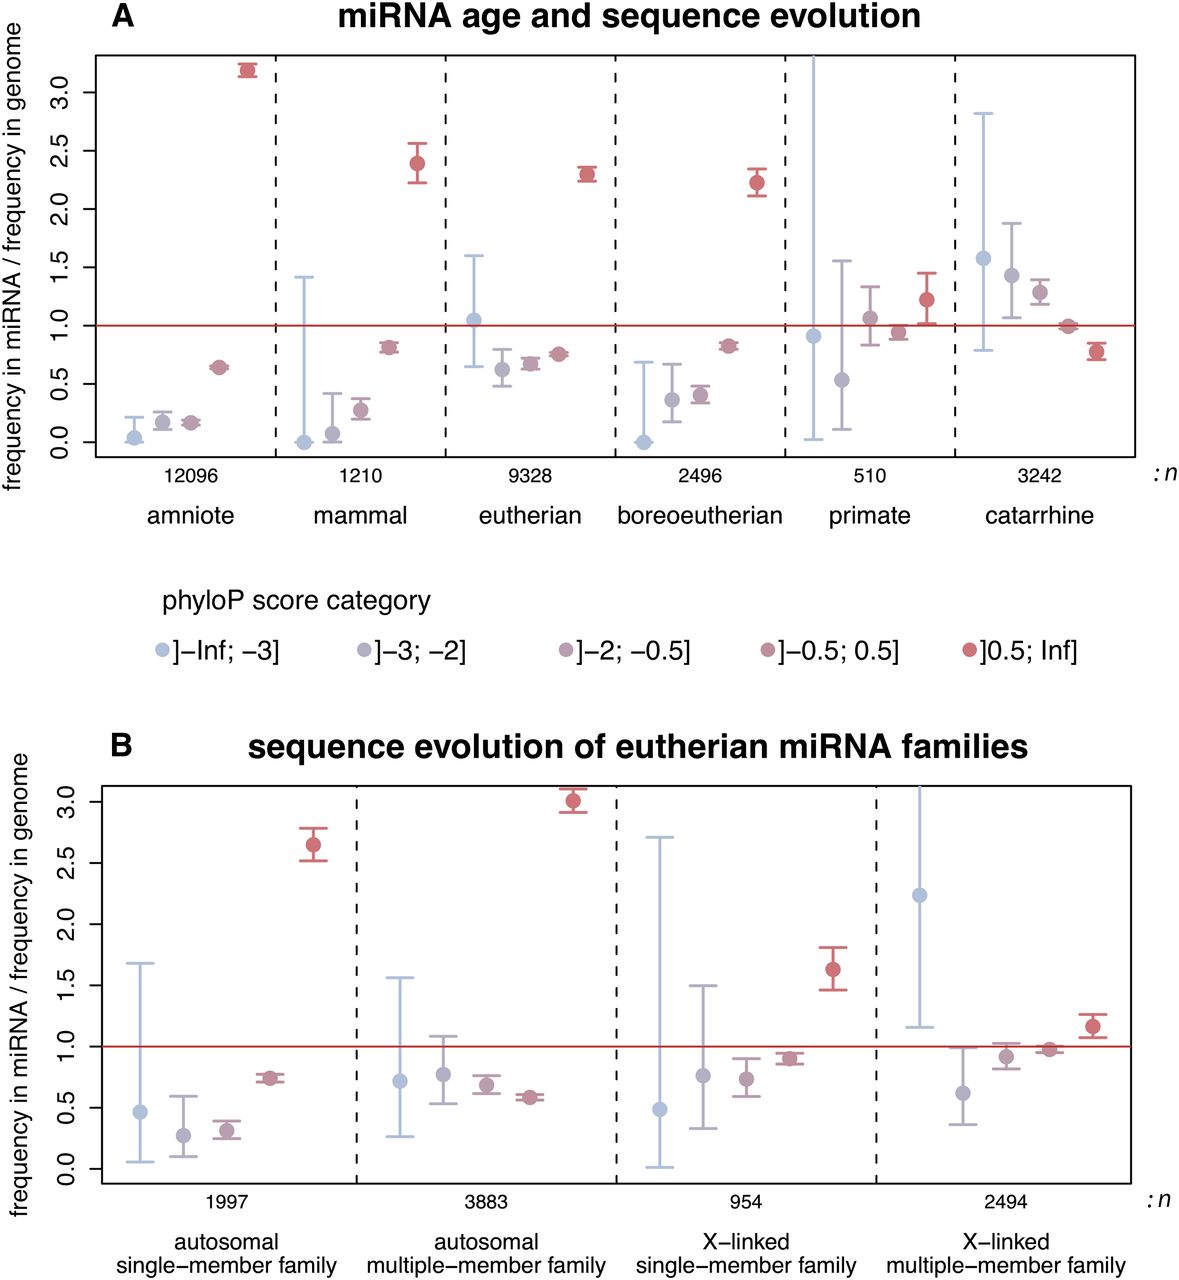
Evolution of miRNA precursor sequences. (A) Comparisons of phyloP score category frequencies between human miRNA precursor sequences and the genomic background. miRNA/genome frequency ratios >1 indicate a higher frequency of sites with a given phyloP score category in miRNAs relative to the genomic background (and vice versa). Primate-based phyloP scores: rapidly evolving sites (score < −0.5); slowly evolving sites (score > 0.5). Error bars: 95% confidence intervals. The age (i.e., phylogenetic distribution; Methods) of miRNAs and the total number of miRNA sites considered (n) are indicated at the bottom of the panel. (B) Sequence evolution of miRNA families on the X chromosome and autosomes. To limit biases due to age variations, only eutherian-specific miRNA families predating the human-mouse split were considered.


