
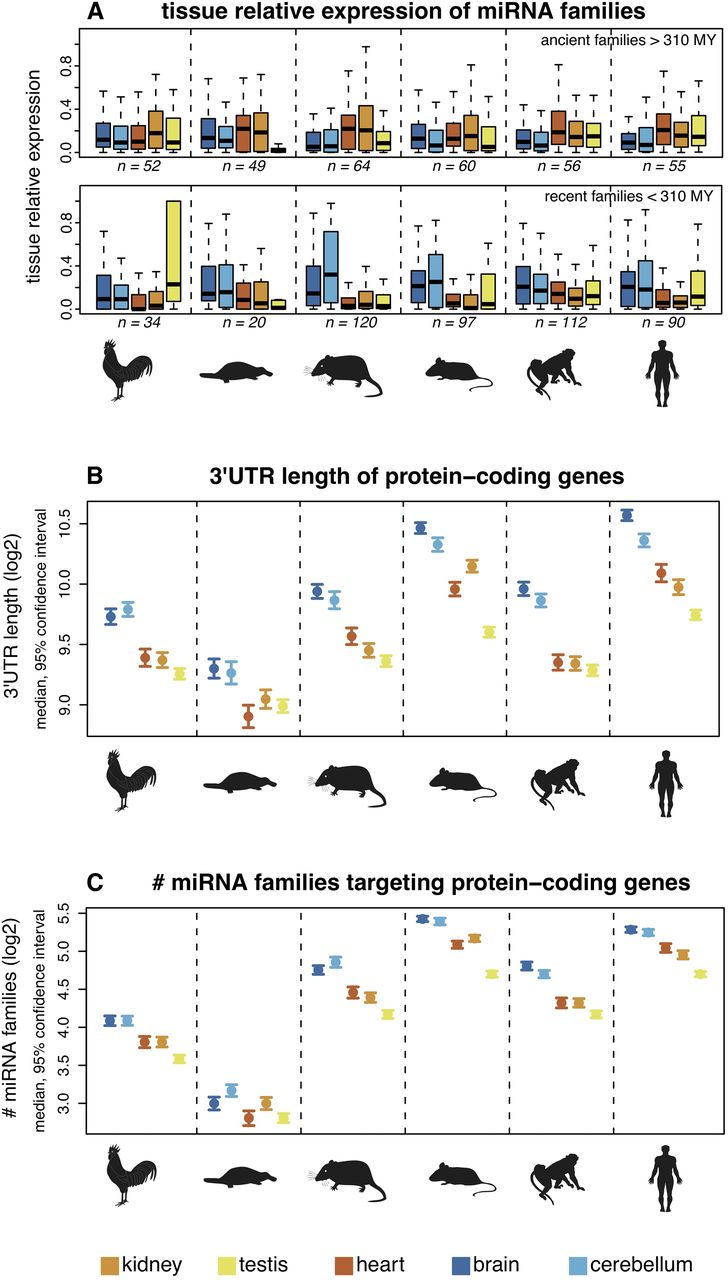
Spatial expression patterns of miRNAs and 3′-UTR structures of predicted target genes. (A) Age of miRNA families and their relative expression by tissues. Relative expression values for each family were calculated as the sum of expression values of all family members in a given tissue divided by their total expression across all tissues. Colored symbols indicate the median relative expression value of miRNA families. Ancient/recent families: families that originated before/after the mammal-bird split. Samples sizes (n) are indicated (note that miRNA families with low expression levels were filtered out in this analysis; see Methods for details). For all but the ancient macaque and recent platypus families, the difference between the maximum and minimum median values is significantly higher than expected by chance (permutation test on tissue labels, corrected P < 0.05). (B) 3′-UTR lengths of protein-coding genes. Protein-coding genes were classified according to the tissue in which they are most highly expressed. (C) Numbers of miRNA families targeting protein-coding genes (using PITA predictions). A miRNA family was considered to target a gene if one or more of the miRNAs were predicted to target the gene's 3′ UTR. Patterns are shown for all miRNA families. Notably, similar results are obtained for ancient and recent families when these are analyzed separately and using TargetScan target predictions (Supplemental Fig. S15).


