
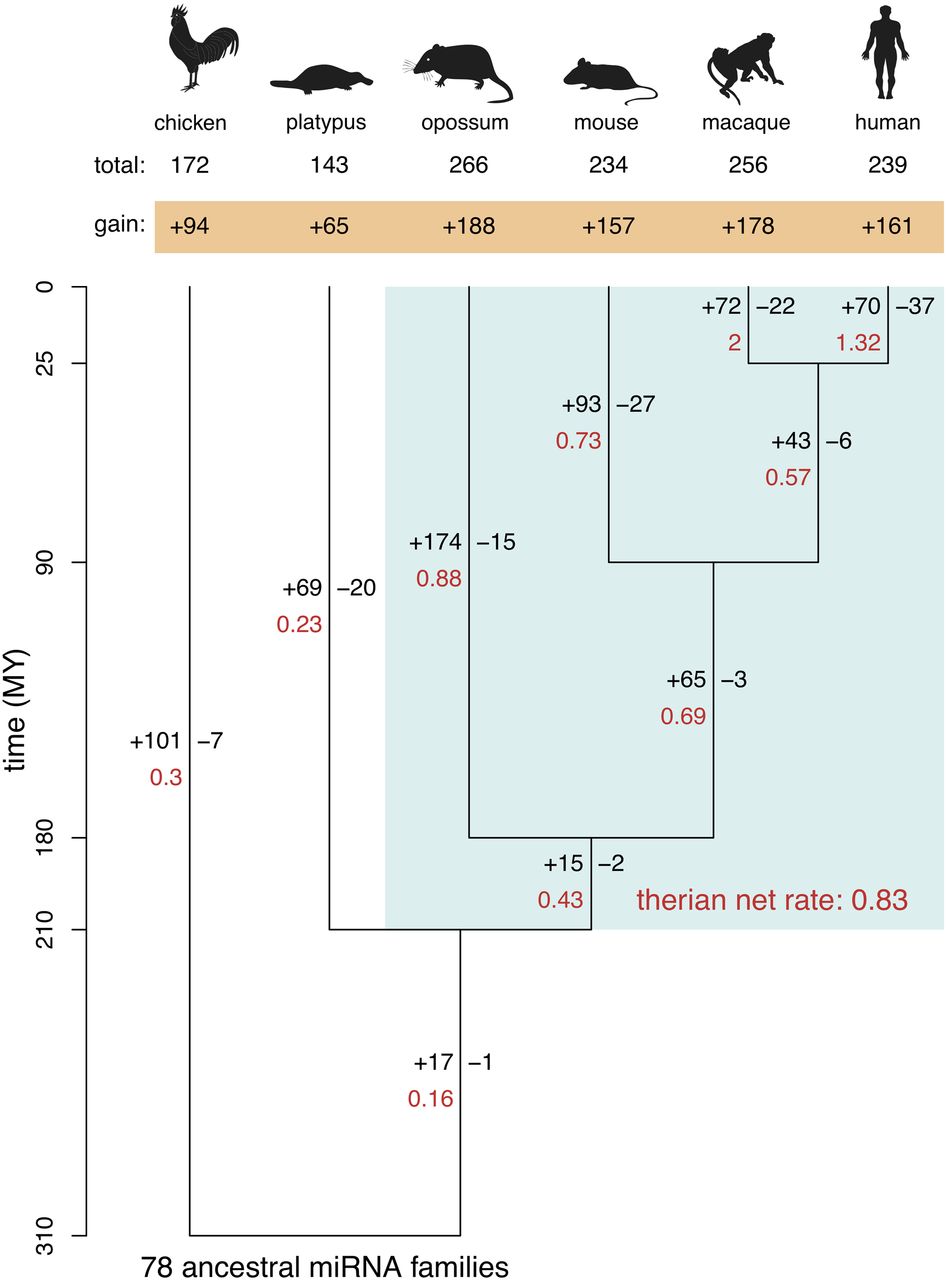
Birth and death rates of miRNA families. Phylogeny of the six studied amniote species and estimated rates of miRNA family gain and loss, as inferred by a maximum likelihood procedure (Methods), are shown. Note that the estimated number of families in the amniote ancestor that have been completely lost during evolution (i.e., with no representative in extant species) is zero. Branch lengths reflect evolutionary divergence times in million of years (MY). Number of gained (+) and lost (–) families (in black) as well as the net gain rate of miRNA families per MY (in red) are indicated next to each branch. The therian net gain rate was computed based on the gain and loss of miRNA families across the entire therian clade (light blue box). The net number of families that have been gained since the bird-mammal split are indicated in the orange box, and the total number of families for each species are indicated above.


