
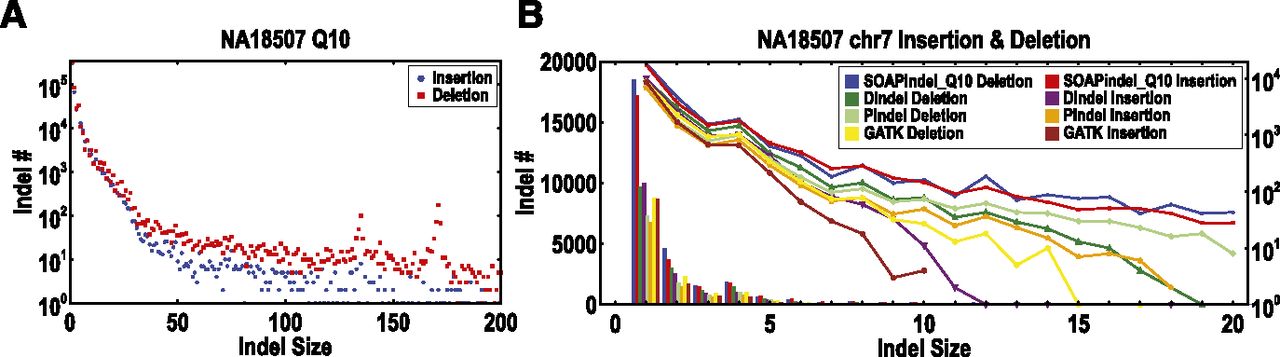
Figure 4.
SOAPindel predictions (Q10) on NA18507. (A) Distribution of insertion and deletion. (B) Comparison of the detected insertion and deletion between SOAPindel, Dindel, Pindel, and GATK on chromosome 7. The result is shown as a histogram of the number of indels (B: left y-axis) and log ratio lines (B: right y-axis).


