
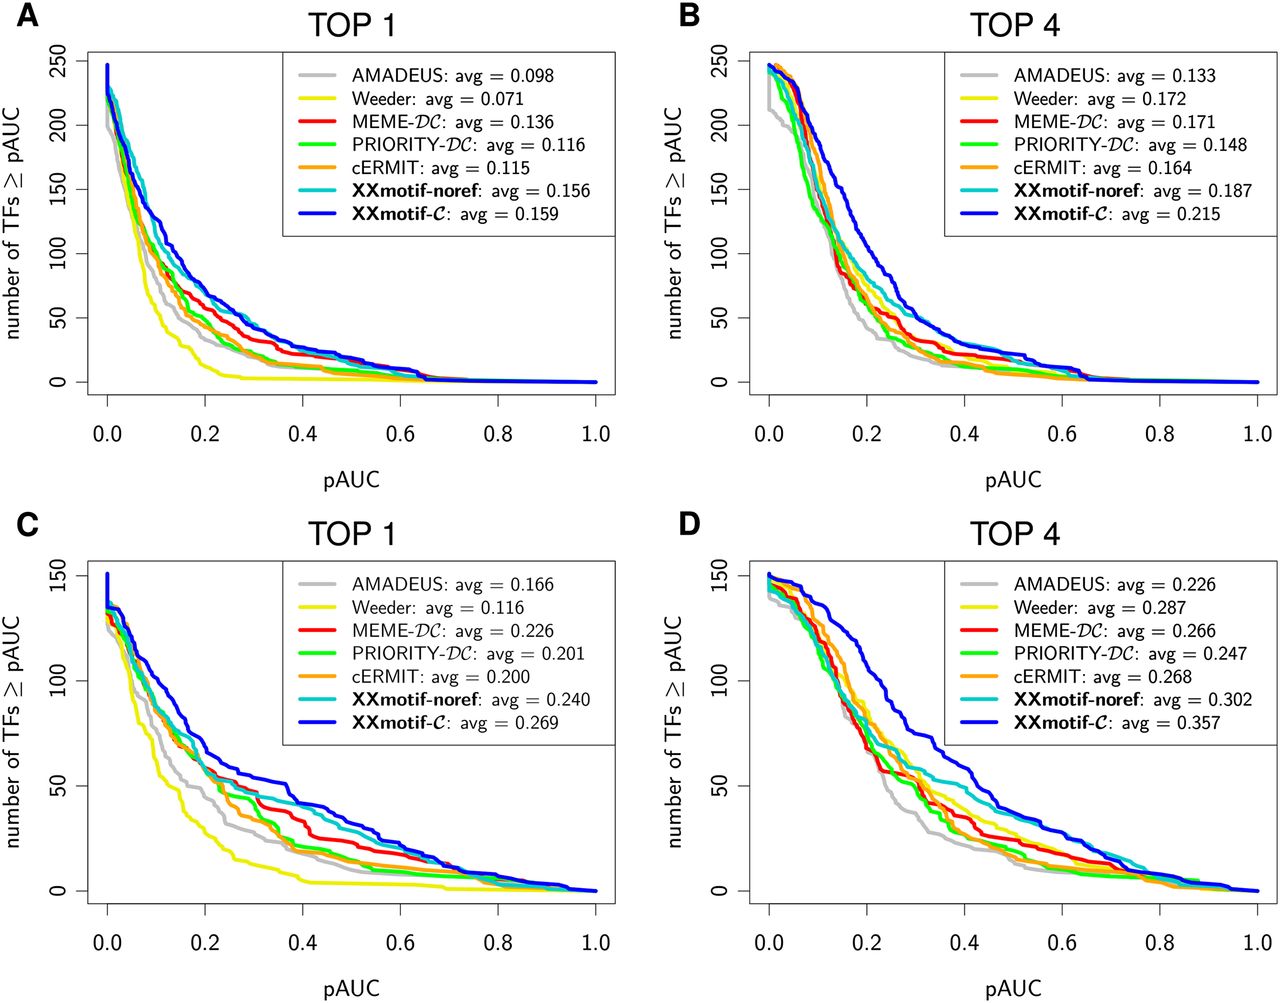
Reference-free PWM quality assessment on yeast ChIP-chip data. The curves quantify how well the scores of the reported PWMs can predict the ChIP enrichment of the sequences. Intergenic regions are ranked by their maximum PWM score. For each predicted PWM, a ROC curve with the number of correct predictions over the number of false predictions is computed, and the partial area under the 5% best-ranked false predictions of the ROC curve (pAUC) is calculated. The plots show the cumulative distributions of pAUC values (A,B) for all 247 ChIP-chip data sets that had at least 10 significantly enriched regions (P-value < 0.001). Regions with a ChIP enrichment P-value of <0.001 are defined as correct predictions, all other regions as false predictions. (C,D) Same as A and B but using a subset of 151 high-quality data sets. For “TOP 4,” the best of the top 4 reported motifs is evaluated. The average pAUC scores are listed in the figure legends.


