
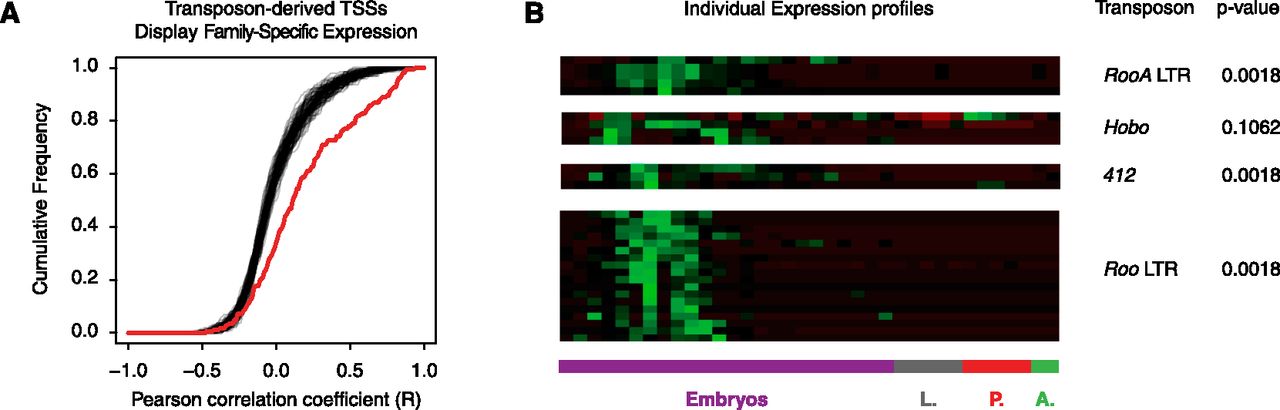
Transposons impart their own expression specificity upon the genes they regulate. (A) Cumulative distribution of pairwise Pearson correlation coefficients (R) between individual transposon-derived TSCs and the class of TEs they are derived from (red curve). This measures the similarity between the expression profile of a given gene-driving insertion and the overall profile of the class it belongs to. The black curves show 100 simulations in which the TSS-transposon class pairs were randomized. Permutation test (10,000 randomizations) P = 0.0001. (B) Z-score-normalized expression profiles for individual subfamilies of transposons. Bonferroni-corrected P-values from permutation tests quantify the significance of the similarity between each group of TSCs and its cognate class profile. Note that 0.0018 is the limit of the power of the statistical tests.


