
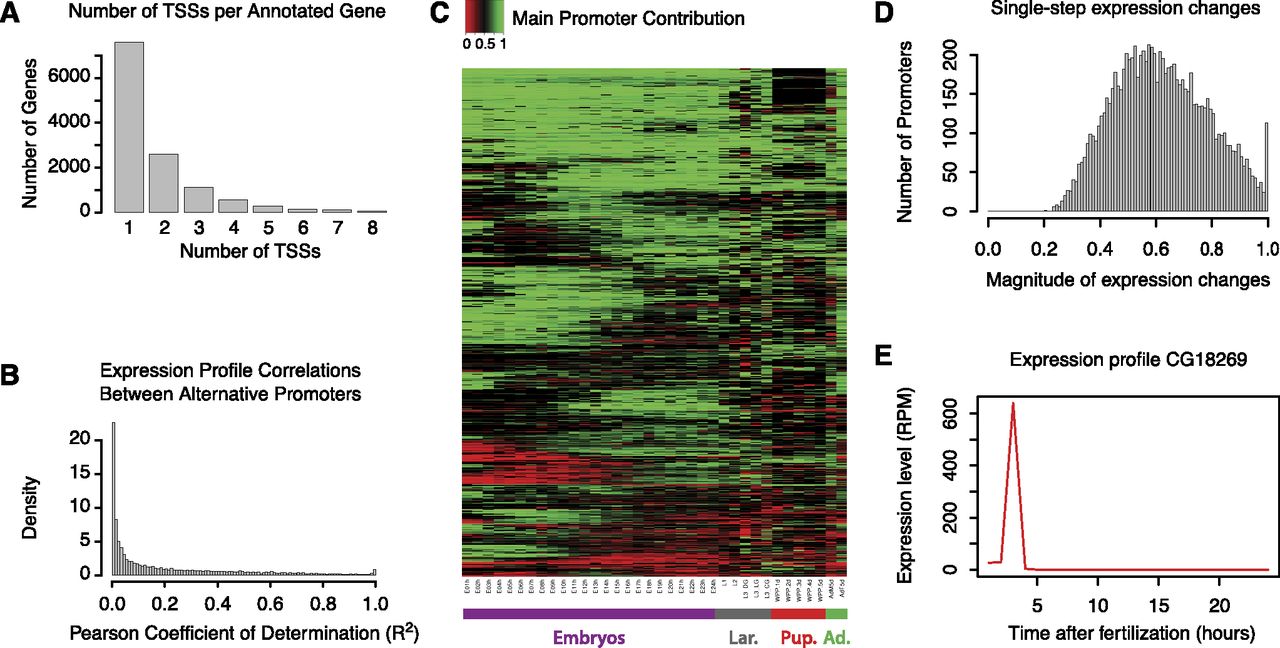
Widespread differential regulation through alternative promoter usage and fast kinetics of regulatory transitions. (A) Number of TSSs detected per annotated gene. Over 40% of all expressed genes have at least two alternative TSSs. (A small number of genes are excluded from the graph [more than 10 TSSs], but these are probably affected by technical artifacts.) (B) Distribution of pairwise Pearson's coefficients of determination (R2) between the full expression profiles (36 timepoints) of alternative promoters. This gives a measure of the similarity between the expression profiles of alternative promoters. Only TSCs with a maximum expression level ≥10 RPM were included. Note the overall absence of correlation (median coefficient, 0.108). (C) Temporal dynamics of developmental transitions between alternative promoters. The heatmap represents the fraction of total expression contributed by the main promoter at each timepoint for 1295 genes that display pronounced transitions between promoters (see Methods). Note the diversity in the timing of promoter transitions. (D) Maximal fraction of the dynamic range of the profile of a given TSS spanned in a single hour during embryonic development (24 timepoints, 0–24 h). Median is 60.8%. Only genes whose expression range spans at least an order of magnitude and whose maximum expression level exceeds 10 RPM were considered in this analysis. (E) Example of a gene with fast transitions kinetics of high absolute magnitude.


