
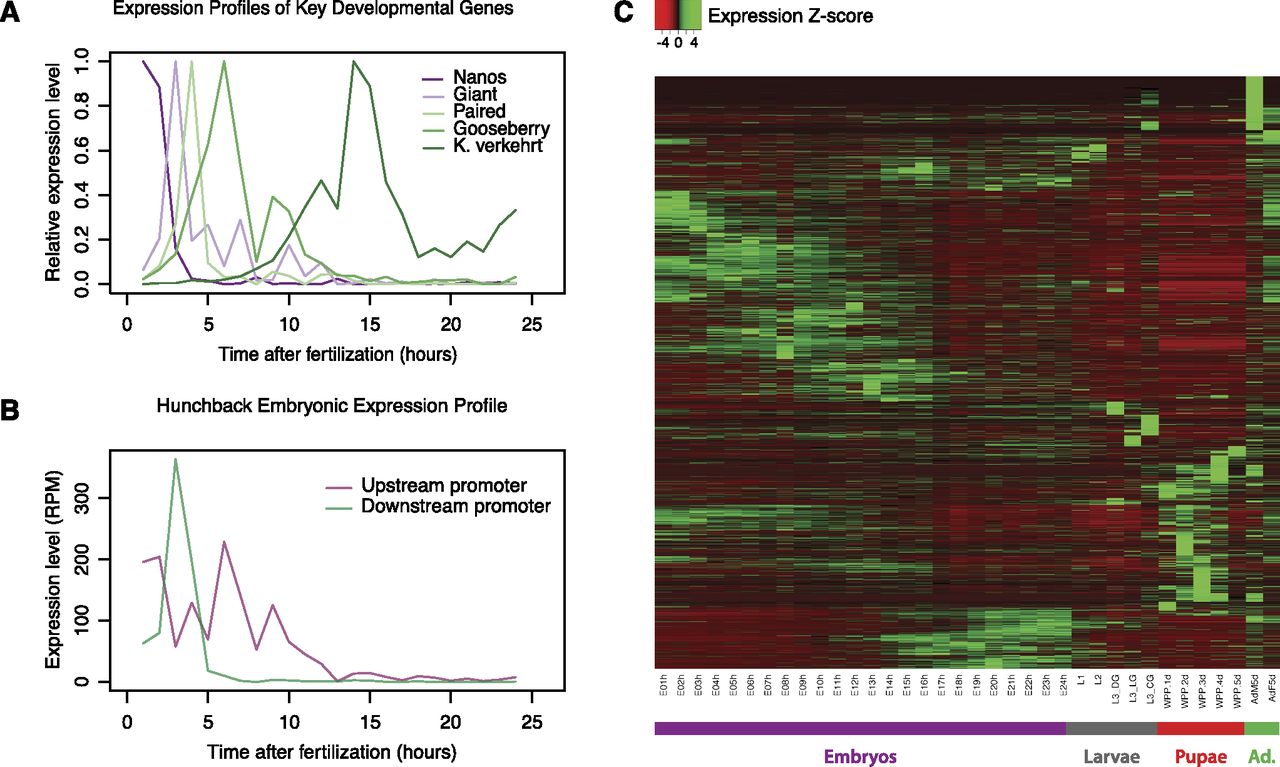
RAMPAGE recapitulates known expression profiles and establishes genome-wide promoter activity dynamics. (A) Expression profiles of well-characterized key developmental genes during embryonic development. Note the sharpness of the profiles afforded by the high temporal resolution of the timecourse. (K. verkehrt indicates krotzkopf verkehrt.) (B) Differential expression of alternative promoters (hunchback locus). Our data fully recapitulate the expression pattern for hb that has been characterized in previous work (Schroder et al. 1988). The hb mRNAs transcribed from the upstream (maternal) promoter are predominant immediately after egg laying and decay rapidly as the downstream promoter starts being expressed, displaying maximal expression 2–3 h after egg laying. The upstream promoter is active again with a second peak at 5–6 h. (C) Heatmap representing the Z-score normalized expression profiles for the 24,264 promoters we could attribute to annotated genes based on cDNA structure.


