
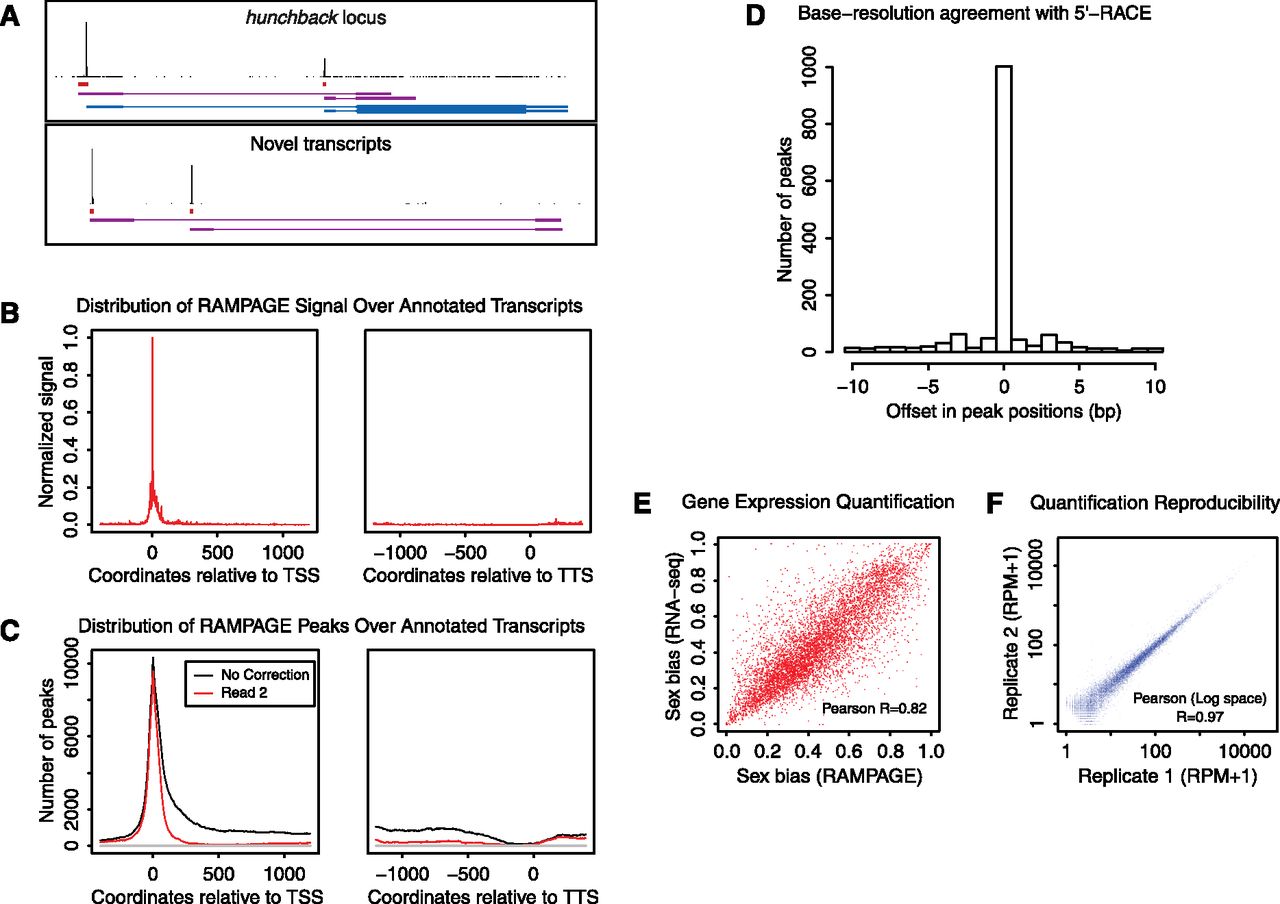
RAMPAGE: specific, accurate, quantitative paired-end sequencing of 5′complete cDNAs. (A) Graphical representation of the data at the hunchback gene locus and at an unannotated locus harboring novel transcripts. For each panel, the top track shows the density of cDNA 5′ ends per position on the upper strand, which can be interpreted as a single base-resolution profile of transcription initiation activity. The second track represents the peaks (i.e., TSS clusters) called from that density profile. The third track shows the partial transcript models reconstructed ab initio from our sequencing data using Cufflinks. For the upper panel, the fourth track displays FlyBase transcript annotations. For the bottom panel, note that paired-end information allows one to infer a functional link between the two promoters, which appear to be alternative promoters for a common locus. (B) Metaprofile of signal density over all FlyBase r5.32 transcript annotations. (TSS) Transcription start site; (TTS) transcription termination site. (C) Metaprofile of peak density over annotated transcripts. (Red curve, downstream read coverage correction; black curve, no correction; all other peak-calling parameters were kept identical). (D) Histogram of the cross-correlation of TSS cluster positioning by RLM-RACE and by our method. For each cluster, we determined the positional offset (in base pairs) that maximizes the cross-correlation between the data from the two methods. (E) Comparison of RAMPAGE and standard RNA-seq performance for relative quantification of gene expression. We compared the measures of sex bias in the expression of genes obtained by the two methods. (F) Reproducibility of expression level measurements between biological replicates. ([RPM] Reads per million.)


