
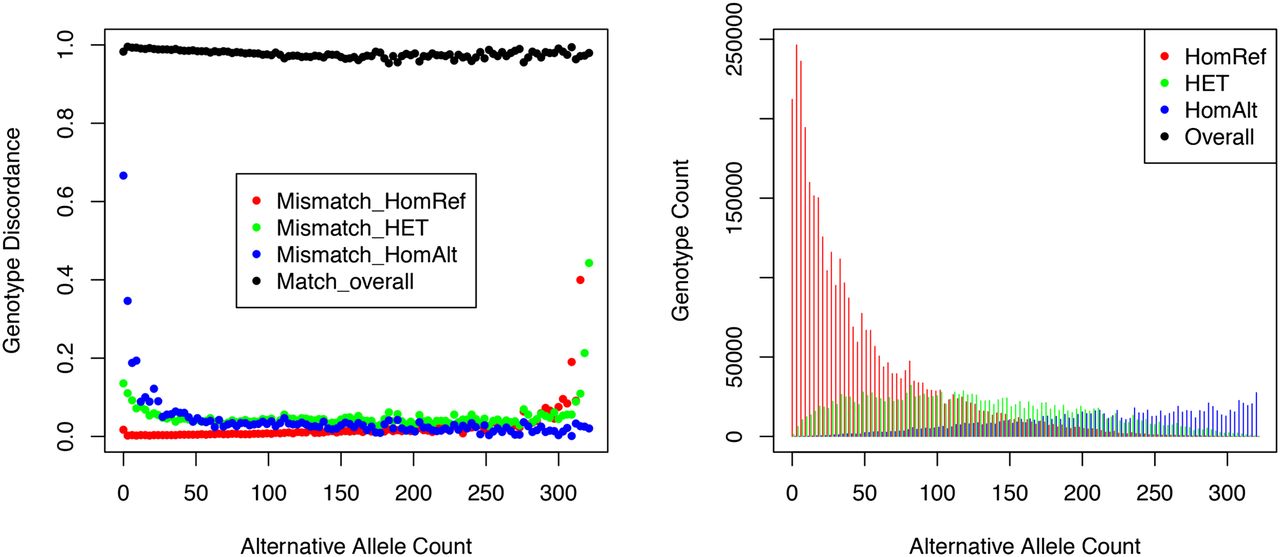
Figure 3.
Genotype distributions and discordance for heterozygotes, reference homozygotes, and alternative homozygotes. (Left) Genotype discordance between the MetaboChip and low-pass sequence data stratified by the alternative allele count. The overall concordance rate is also shown at the top. (Right) Genotype counts.


