
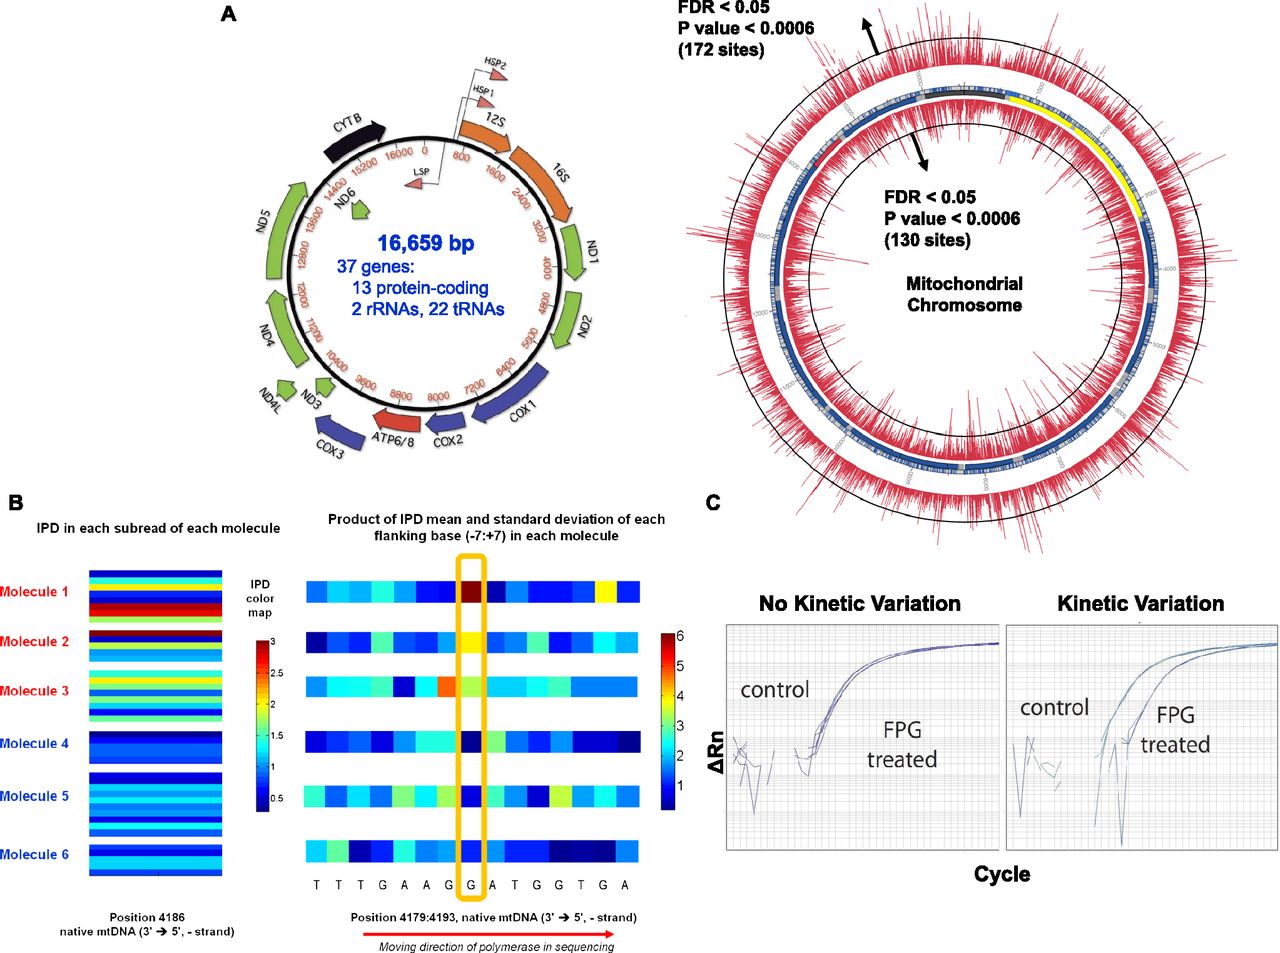
Kinetic variation events detected in the mitochondrial genome. (A) The bottom left circular plot is an annotation of the mitochondrial genome with respect to the genes found on the heavy and light strands. The larger circular plot indicates the –log10 P-values for each position tested on the mitochondrial genome, with inside and outside of the circle representing the heavy and light strands, respectively. (B) Putative 8-oxoG event detected at position 4186 in the mitochondrial genome (heavy strand). (Left) The IPDs values are shown for six molecules from the neuronal mtDNA sample, with each molecule read five to 10 times within individual SMRTbells for each molecule. The color coding reflects the IPD value, with dark blue indicating IPDs <0.5 sec and dark red indicating IDPs >3.0 sec. Molecules 1–3 indicate highly variable IPDs with long IPDs represented, expected if the IPD distribution is exponentially distributed with a high IPD mean. Molecules 4–6 have significantly lower IPD values compared with molecules 1–3. These data suggest that molecules 1–3 are modified at this position compared with molecules 4–6. (Right) The mean IPD computed for each position within each molecule. The mean values at the highlighted test position are clearly different between molecules 1–3 and molecules 4–6, indicating why this site was detected as a kinetic variation event. None of the sites within 10 bases of this test site were detected as kinetic variation events. (C) DNA samples with (right) and without (left) evidence of modification were treated with a glycosylase to create single-strand breaks at oxidatively modified positions. The samples were PCR amplified before and after treatment to demonstrate the degree of modification. First-derivative plots of the amplification are shown.


