
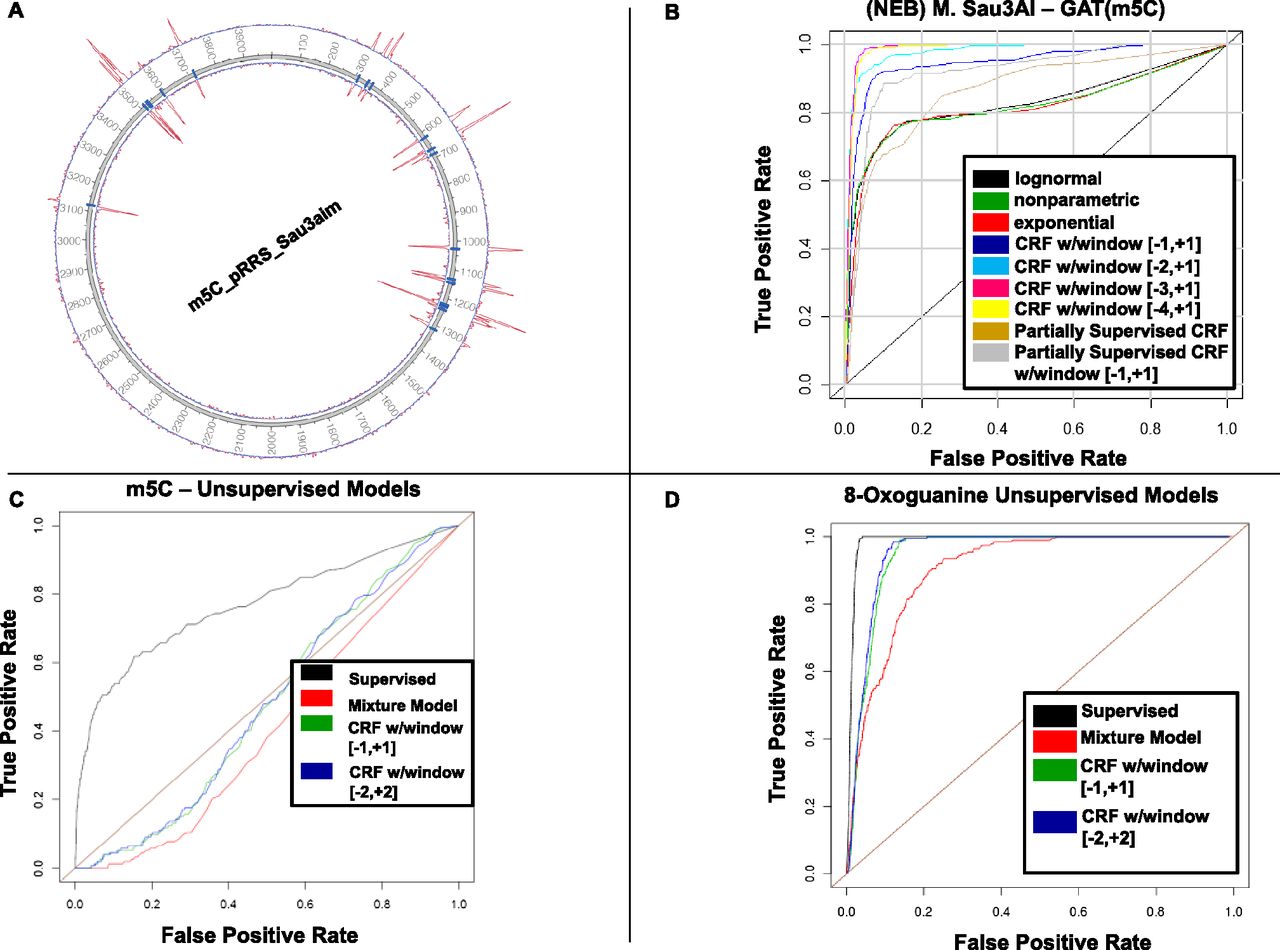
Detecting kinetic variation events using different models derived from the full CRF model. (A) Plasmid pRRS depicted as a circos plot, with the inside of the annulus representing the coordinates of the plasmid, the blue hash marks indicating C residues in a GATC context, and the two red curves representing –log10(P-value) for the single-site likelihood model for the two DNA strands. The P-values are based on 475-fold filtered coverage of the plasmid genome. In this case, at a 5% FDR threshold, all methylated sites in the GATC context were detected and no other sites outside of the GATC context were detected. (B) Receiver operator characteristic (ROC) curves for the supervised models described in the text applied to the M.Sau3AI plasmid and control data, with false-positive rate (FPR) plotted along the x-axis, and true-positive rate (TPR) plotted along the y-axis. The [−1,+1], [−2,+1], [−3,+1], and [−4,+1] labels in the legend indicate the window size and position with respect to the test site (at 0 in each interval) to which the multisite model was fitted. (C) ROC curves for the unsupervised models described in the text applied to the M.Sau3AI plasmid data only. The ROC curves dipping below the diagonal results from the relatively small number of true positive sites (relative to all sites tested) and that these sites were detected at a lower rate compared with false-positive sites. (D) ROC curves for the unsupervised models applied to the 8-oxoG data.


