
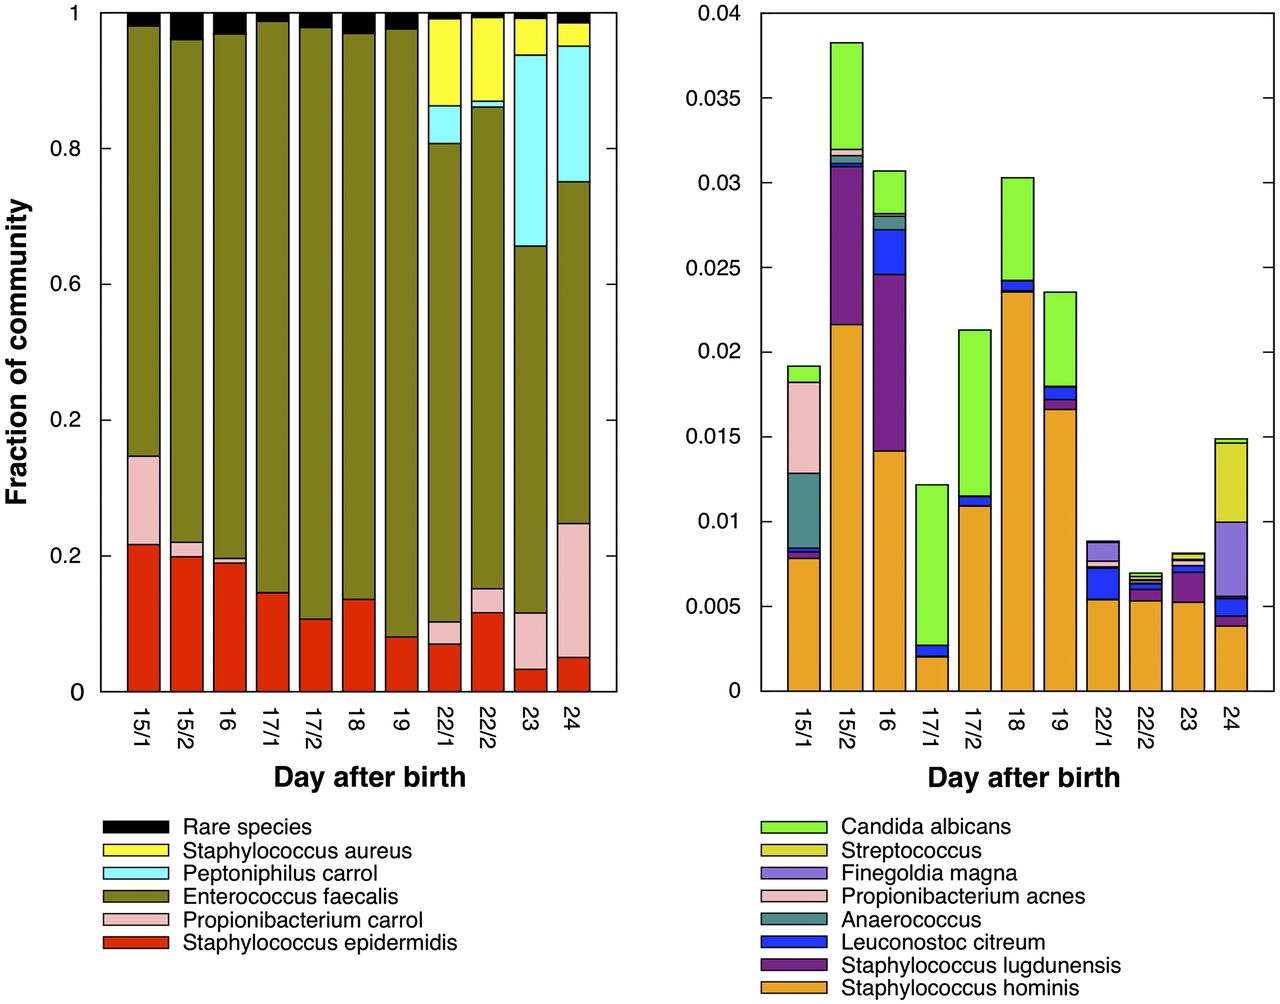
Figure 2.
Relative abundance in the community of abundant (left) and rare (right) species. Abundance was computed based on read mapping to unique regions on the assembled genomes.
(Downloading may take up to 30 seconds. If the slide opens in your browser, select File -> Save As to save it.)
Click on image to view larger version.
Relative abundance in the community of abundant (left) and rare (right) species. Abundance was computed based on read mapping to unique regions on the assembled genomes.
 CiteULike
 Delicious
 Digg
Digg Facebook
 Google+
 Reddit
 Twitter
