
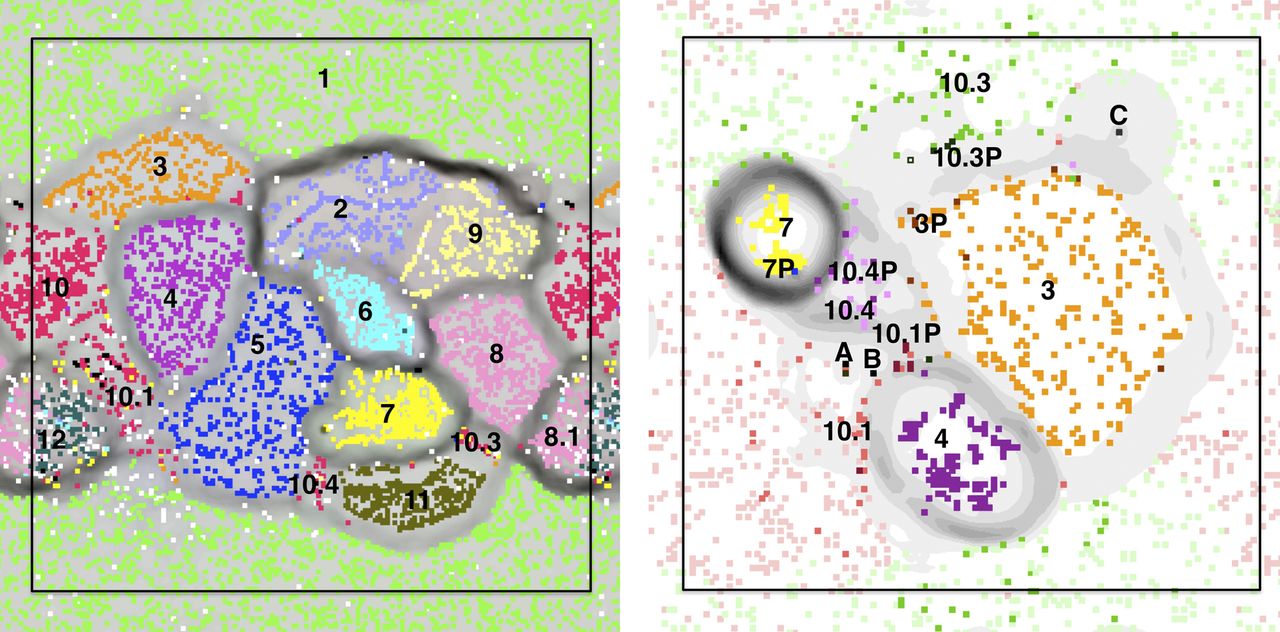
Time series-based ESOM binning of the whole data set (left) and Staphylococcus scaffolds (right). (Left) An ESOM in which each point represents a 500- to 6000-bp segment. Data points are colored based on their scaffold's best hit from all published genomes in the NCBI nucleotide database (white data points have no significant hit). Note that the map is periodic. Clusters are: 1. Candida albicans; 2. Finegoldia magna; 3. Staphylococcus hominis; 4. Staphylococcus lugdunensis; 5. Leuconostoc citreum; 6. Peptoniphilus Carrol (novel species); 7. Staphylococcus aureus; 8. Propionibacterium Carrol (novel species); 8.1 Propionibacterium acnes; 9. Streptococcus; 10. Staphylococcus epidermidis, regions on the genome that are common to all strains; 10.1 strain 1 and some low abundance scaffolds that probably belong to rare S. epidermidis strains; 10.3. regions unique to S. epidermidis strain 3; 10.4. regions unique to S. epidermidis strain 4; 11. Enterococcus faecalis; and 12. Anaerococcus. (Right) An ESOM of the Staphylococcus genomes (numbers are the same as in the left panel), their plasmids (extension “P”) and infecting phage (A: phage 13; B: phage 14; and C: phage 46). For S. epidermidis strain 1, dark red represents segments unique to the strain, while light red represents regions common to both strain 1 and strain 3 (likewise dark/light green for strain 3).


