
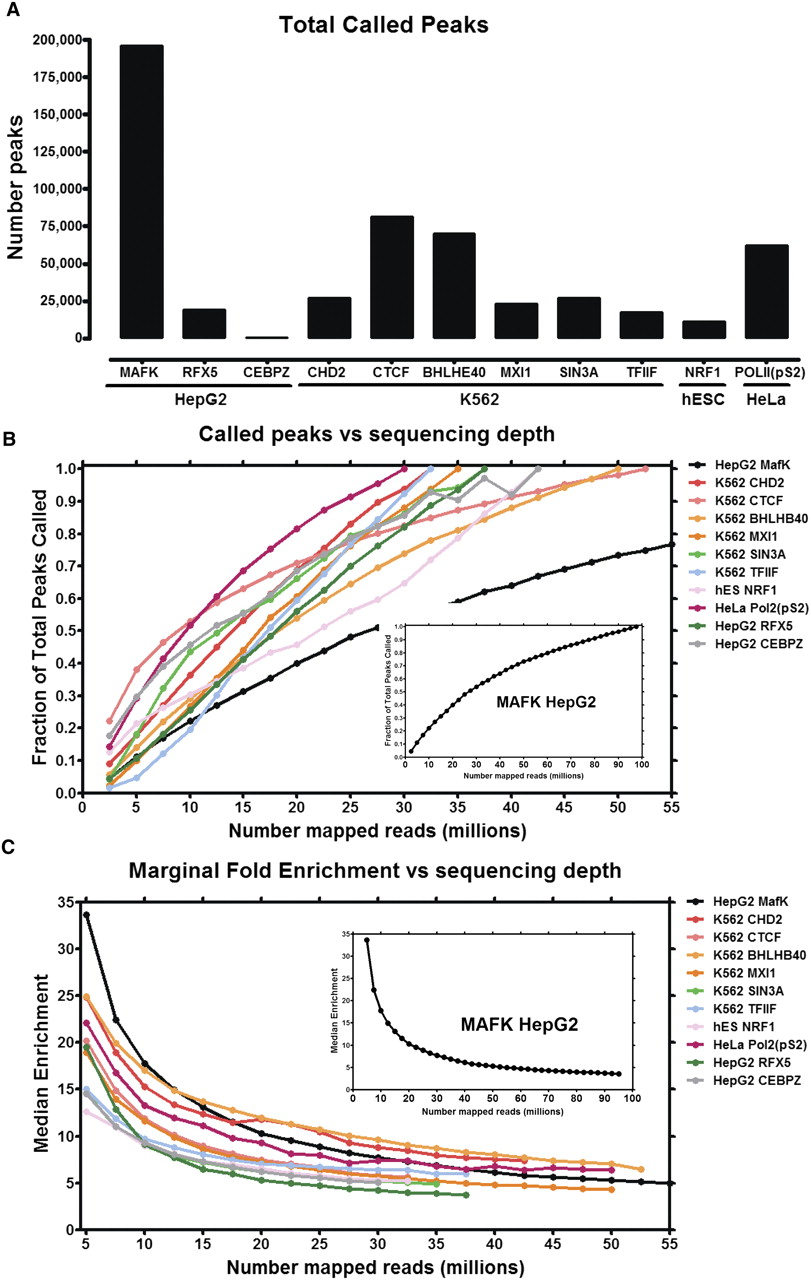
Peak counts depend on sequencing depth. (A) Number of peaks called with Peak-seq (0.01% FDR cut-off) for 11 ENCODE ChIP-seq data sets. (B) Called peak numbers for 11 ChIP-seq data sets as a function of the number of uniquely mapped reads used for peak calling. (Inset) Called peak data for the MAFK data set from HepG2 cells, currently the most deeply sequenced ENCODE ChIP-seq data set (displayed separately due to the significantly larger number of reads relative to the other data sets). Data sets are indicated by cell line and transcription factor (e.g., cell line HepG2, transcription factor MAFK). (C) Fold-enrichment for newly called peaks as a function of sequencing depth. For each incremental addition of 2.5 million uniquely mapped reads, the median fold-enrichment for newly called peaks as compared with an IgG control data set sequenced to identical depth is plotted.


