
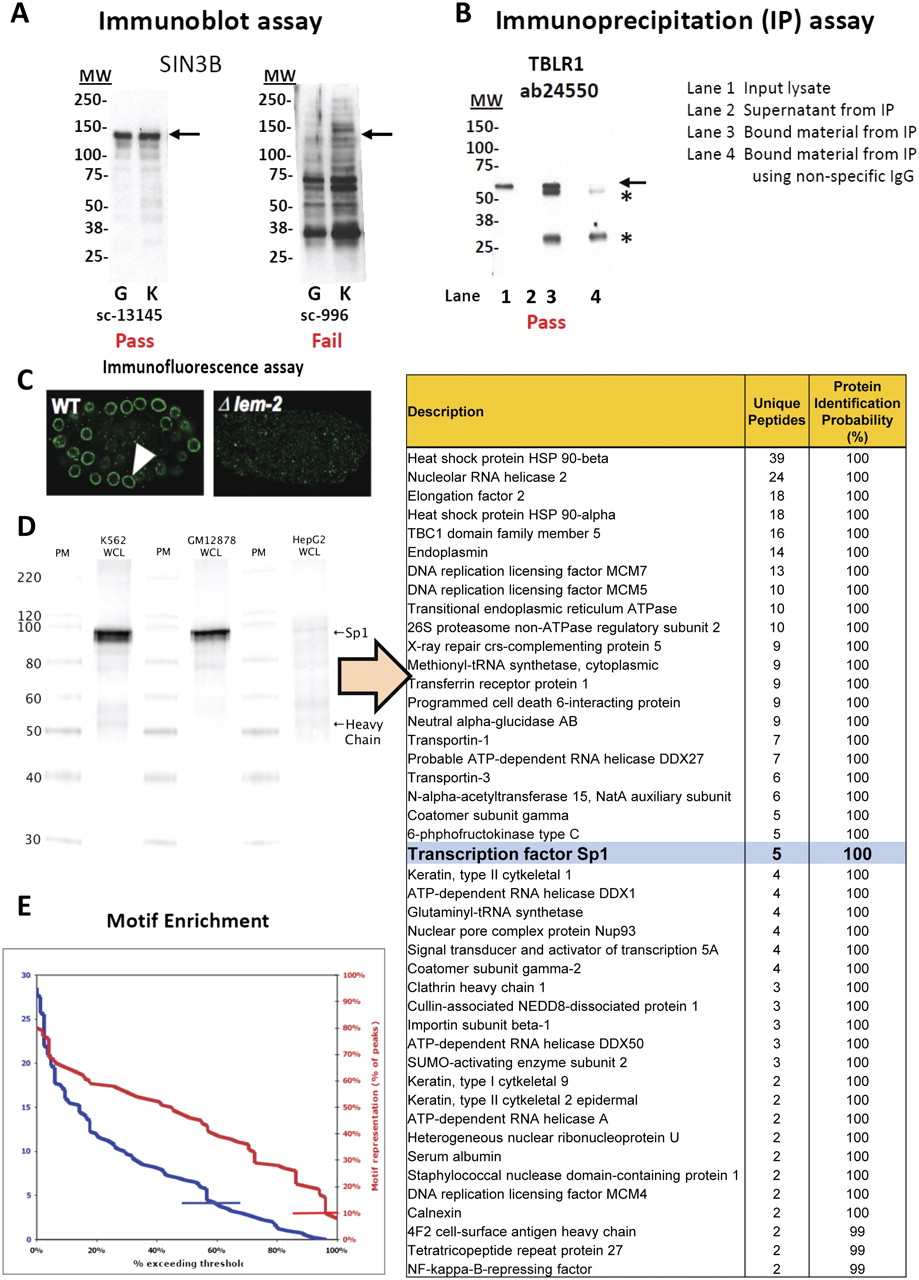
Representative results from antibody characterization assays. (A) Immunoblot analyses of antibodies against SIN3B that (left) pass quality control (Santa Cruz sc13145) and (right) fail quality control (Santa Cruz sc996). Lanes contain nuclear extract from GM12878 cells (G) and K562 cells (K). Arrows indicate band of expected size of 133 kDa. Molecular weights (MW) are in kilodaltons. (B) Immunoblot analysis of an antibody against TBLR1 (Abcam ab24550) that passes quality control and can be used for immunoprecipitation. Immunoprecipitations (IPs) were performed from nuclear lysates of K562 cells. Arrow indicates band of expected size (56 kDa) that is detected in the input lysate (lane 1) and is efficiently (cf. lanes 3 and 2) and specifically (absent in lane 4) immunoprecipitated. (*) IgG light and heavy chains. (C) Immunofluorescence analyses of antibodies that pass (left) and fail (right) quality control. (D) Immunoprecipitation/mass spectrometry analysis of an antibody against SP1 (Santa Cruz sc-17824). Whole-cell lysates (WCL) of K562, GM12878, and HepG2 were immunoprecipitated, and a band of expected size (∼106 kDa) was detected on a Western blot with SP1 primary antibody. The immunoprecipitation was repeated in K562 WCL, separated on a gel, stained with Coomassie Blue, and the band previously detected on the Western blot was excised and analyzed by mass spectrometry. Peptides were identified using MASCOT (Matrix Science) with probability-based matching at P < 0.05. Subsequent analysis was performed in Scaffold (Proteome Software, Inc.) at 0.0% protein FDR and 0.0% peptide FDR. SP1 protein was detected (along with common contaminants that are often obtained in control experiments) (data not shown) and is highlighted in bold and light blue. (E) Histogram depicting motif fold-enrichment (blue) for all transcription factors for which ENCODE ChIP-seq data is available (85 factors). Enrichments are relative to all DNase-accessible sites and were corrected for sequence bias using shuffle motifs. Motif searches were conducted with a matching stringency of 4–6. Where multiple data sets are available for a factor, the data set with the highest enrichment was counted. Data sets that meet the ENCODE standard of fourfold enrichment (indicated by blue line) were found for 60% of factors. Motif representation, as a percentage of all analyzed peaks, is shown in red for all factors for which a data set exists that exceeds the enrichment standard. A total of 96% of these data sets meet the ENCODE standard of >10% motif representation (red line). All calculations were carried out on peaks identified by IDR analysis (0.01 cut-off).


