
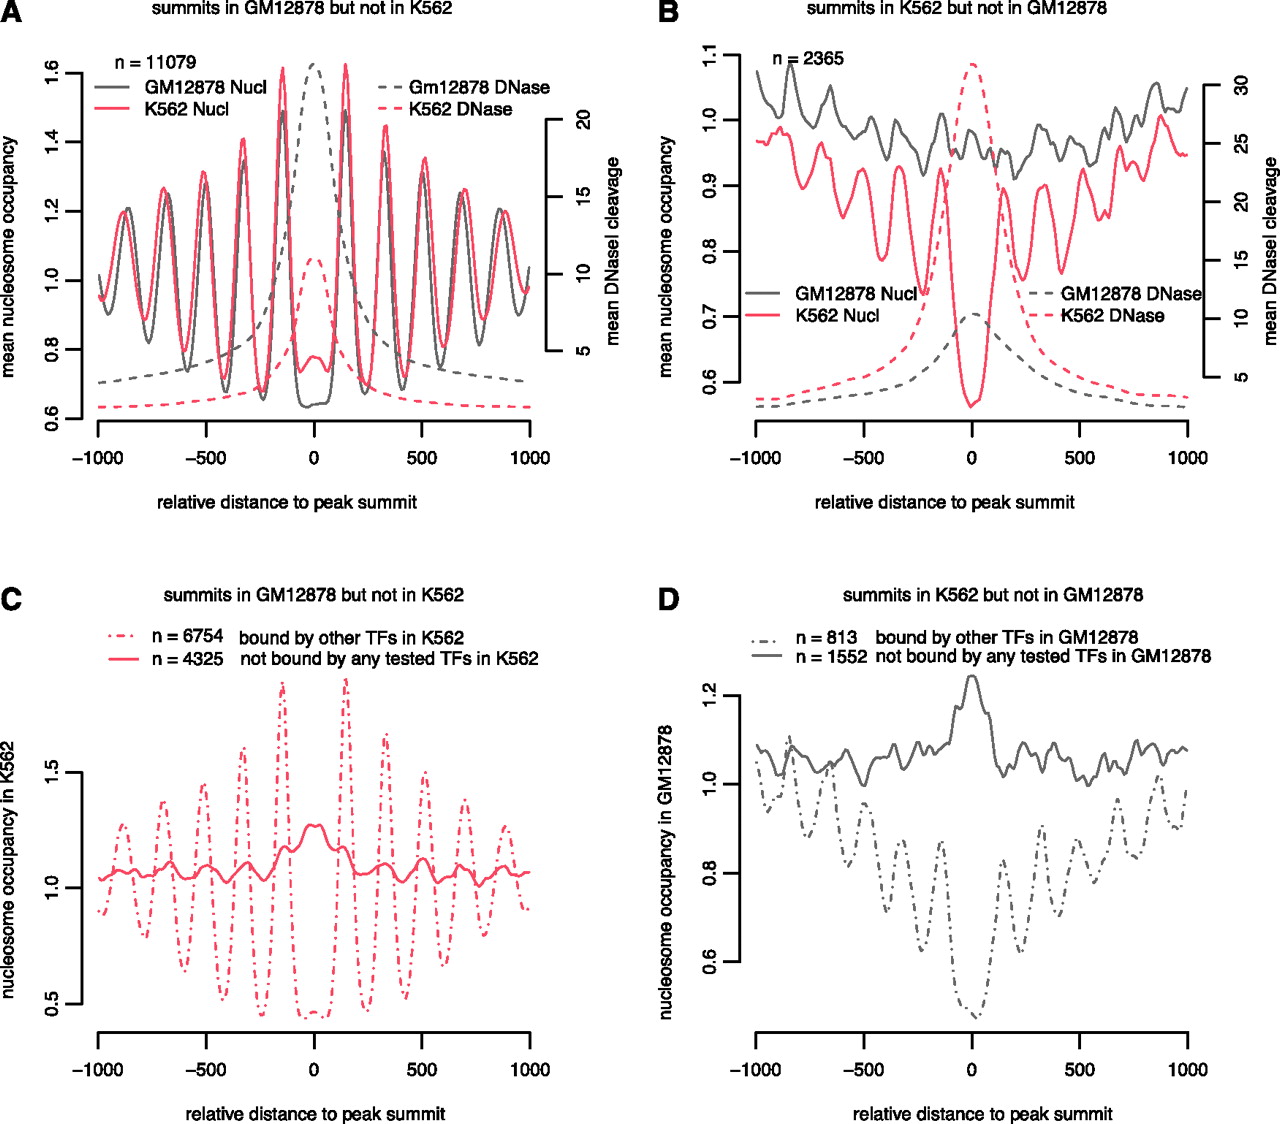
Chromatin structure around YY1 ChIP-seq peaks occupied differentially between GM12878 and K562. (A) Nucleosome occupancy profiles (solid lines) and DNase I cleavage profiles (dashed lines) anchored on the summits of YY1 peaks in GM12878 but not in K562. Note the average nucleosome occupancy at these peaks (x = 0) is lower in GM12878 than in K562, while the average DNase I cleavage at these peaks is higher in GM12878 than in K562. (B) Same as A, but around the summits of YY1 peaks in K562 but not in GM12878. (C) Nucleosome occupancy profiles in K562 anchored on the summits of the ChIP-seq peaks occupied by YY1 in GM12878 but not in K562. These 11,079 peaks were divided into two groups: 6754 peaks were bound by one or more TFs in K562 (dashed line), and 4325 peaks were not bound by any TF for which we had ChIP-seq data in K562 (solid line). Note high nucleosome occupancy at the summits of the unoccupied peaks (x = 0) and the lack of positioned nucleosomes flanking the unbound peaks, in sharp contrast to the lack of nucleosome occupancy at the peak summits and well-positioned nucleosomes flanking the peaks bound by other TFs. (D) Same as C, but around the summits of the ChIP-seq peaks occupied by YY1 in K562 but not in GM12878.


