
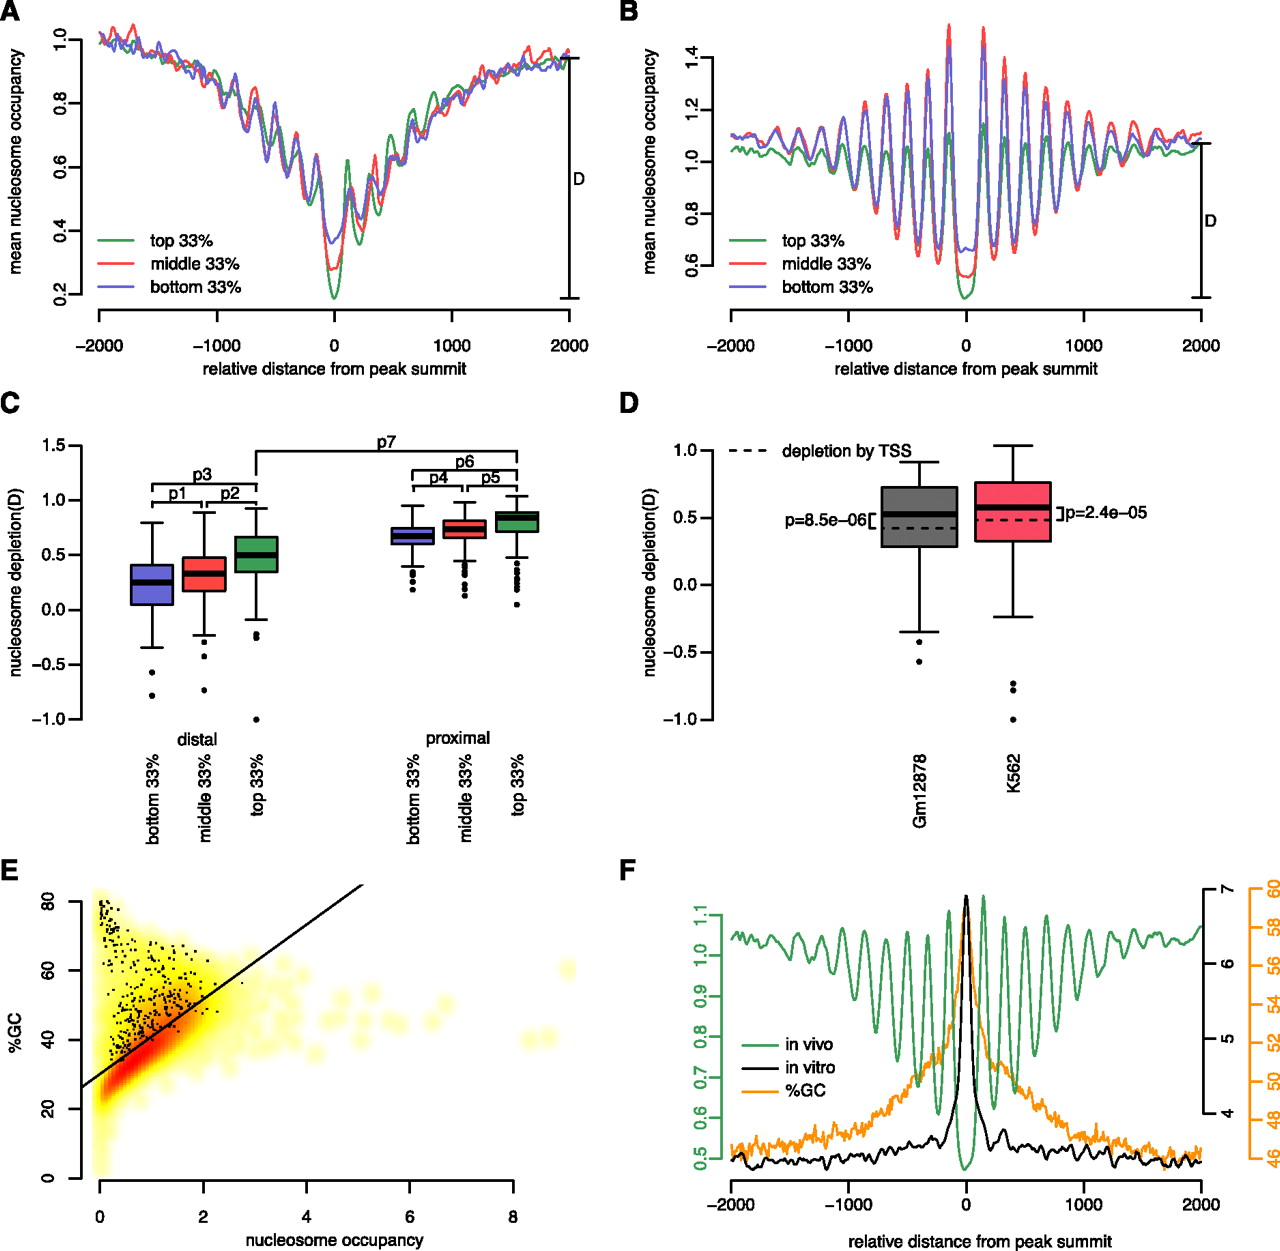
Chromatin structure and GC content around TF binding regions. (A,B) Nucleosome occupancy profiles anchored on the summits of TSS-proximal (A) and TSS-distal (B) peaks of YY1 grouped by ChIP-seq signal strength: top (green), middle (red), and bottom (blue) third peaks in terms of ChIP-seq signal. Nucleosome depletion for the top third peaks is shown as D in each panel. (C) Distribution of nucleosome depletion “D” across all tested TFs, with peaks stratified according to TSS proximity (proximal or distal) and ChIP-seq signal strength (top, middle, or bottom third). P-values for pairwise comparisons based on paired Wilcoxon rank-sum tests are: P1 = 8.2 × 10⁻¹⁷, P2 = 7.6 × 10⁻²¹, P3 = 3.8 × 10⁻²³, P4 = 8.8 × 10⁻¹⁰, P5 = 1.1 × 10⁻⁹, P6 = 1.1 × 10⁻¹¹, and P7 = 6.6 × 10⁻²². (D) TF binding is correlated with significantly more nucleosome depletion than TSS. Wilcoxon rank-sum test P-values are shown separately for GM12878 and K562 cells. For the box plots in C and D, only those subcategories with 200 or more peaks are included, and whiskers represent the 1.5 inter-quartile range. (E) Nucleosome occupancy genome-wide is correlated with GC%. The smoothed density scatter plot contains 40,000 data points; each data point is a randomly chosen 250-bp region of the human genome. (Black dots) Those regions that overlap with ChIP-seq peaks. (Black line) Least square fit. Pearson correlation coefficient = 0.62; P-value < 2.2 × 10⁻¹⁶. (F) Comparison of in vivo (green) and in vitro (black) nucleosome occupancy profiles around peak summits of YY1. GC% profile around the same summits is plotted in orange. Note elevated GC% at summit coincides with high in vitro nucleosome occupancy and low in vivo nucleosome occupancy.


