
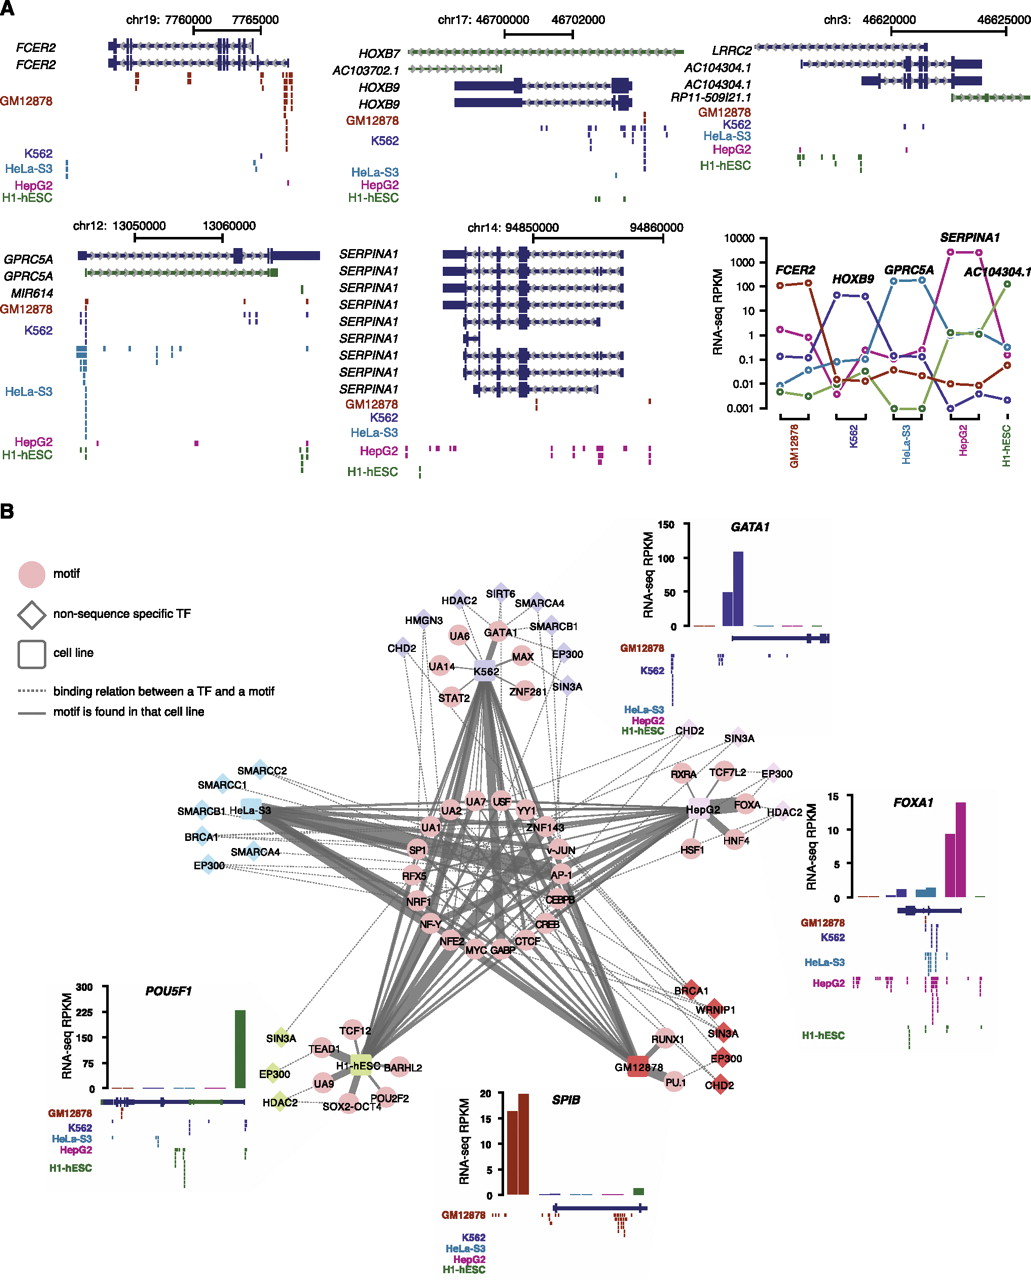
Cell-type–specific binding of sequence-specific and non-sequence-specific TFs. (A) Abundant TF binding sites are observed near cell-line–specific transcripts. Binding sites are shown as vertical bars and colored by cell line (dark blue for K562, red for HepG2, brown for GM12878, green for H1-hESC, and cyan for HeLa-S3). (Bottom, right) Expression levels (in RPKM) for example cell-line–specific transcripts across the five cell lines with the most ChIP-seq data. (B) Secondary motifs identified in the ChIP-seq data sets of sequence-specific TFs and their enrichment in the ChIP-seq peaks of non-sequence-specific TFs. The five cell lines are indicated with color-coded squares, noncanonical motifs of sequence-specific TFs are shown in pink circles and a solid line connecting each motif to the respective cell line. The thickness of the solid line is proportional to the normalized frequency in which a noncanonical motif is discovered in a particular cell line. Non-sequence-specific TFs are shown in diamonds whose colors match the color of the cell line if there is a ChIP-seq data set of the TF in that cell line. Dashed lines connect non-sequence-specific TFs and noncanonical motifs, indicating that a noncanonical motif of a sequence-specific TF is enriched in the ChIP-seq peaks of the non-sequence-specific TF. (Four insets) Expression profiles of sequence-specific TFs whose canonical motifs are found to be specific to a cell type and the TF binding sites around the genes that encode these TFs in the appropriate cell line. The expression levels in each cell line are assigned a similar color as the cell line. For four cell lines, two biological replicates were available for RNA-seq data; hence, there are two bars for each of these cell lines. Only one biological replicate was available for H1-hESC.


