
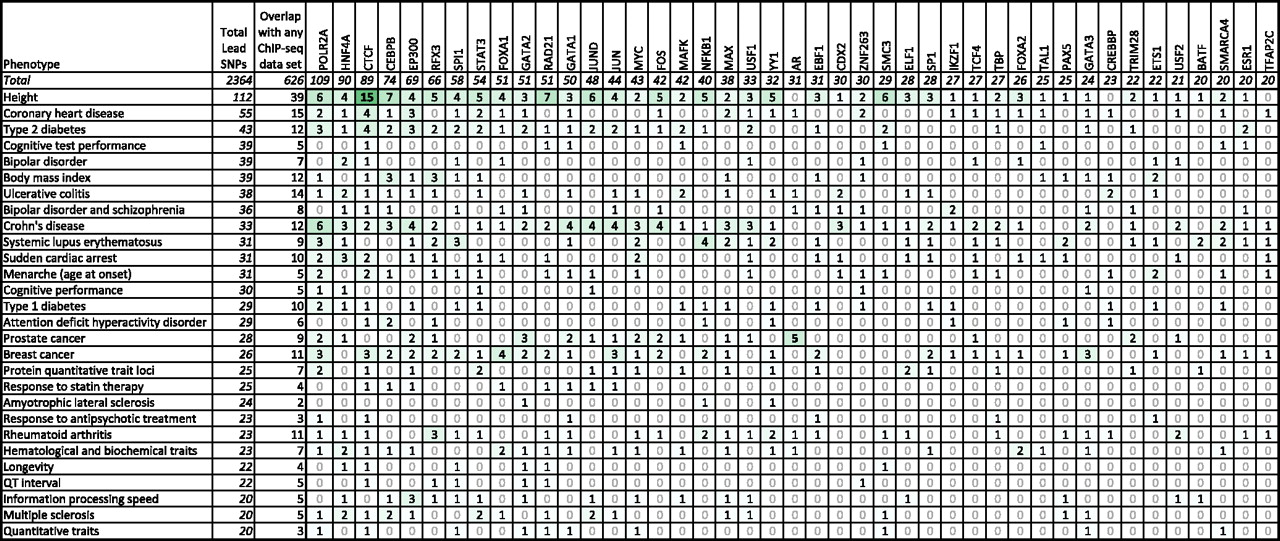
Phenotype level overview of the overlap between associations and ChIP-seq binding. This matrix view shows phenotypes vertically and DNA binding proteins assessed using ChIP-seq horizontally. Each cell represents the number of lead SNPs for the respective phenotype that overlap with a ChIP-seq peak for the respective DNA binding protein or are in strong LD (r2 ≥ 0.8 in the CEU HapMap 2 population) with a SNP that overlaps such a peak. Only phenotypes with at least 20 lead SNPs and DNA binding proteins overlapping at least 20 functional SNPs are shown, but totals are computed over the entire data set. The significant interaction between height-associated functional SNPs and CTCF, as well as the association between prostate cancer–associated functional SNPs and androgen receptor (AR), are represented in bold font.


