
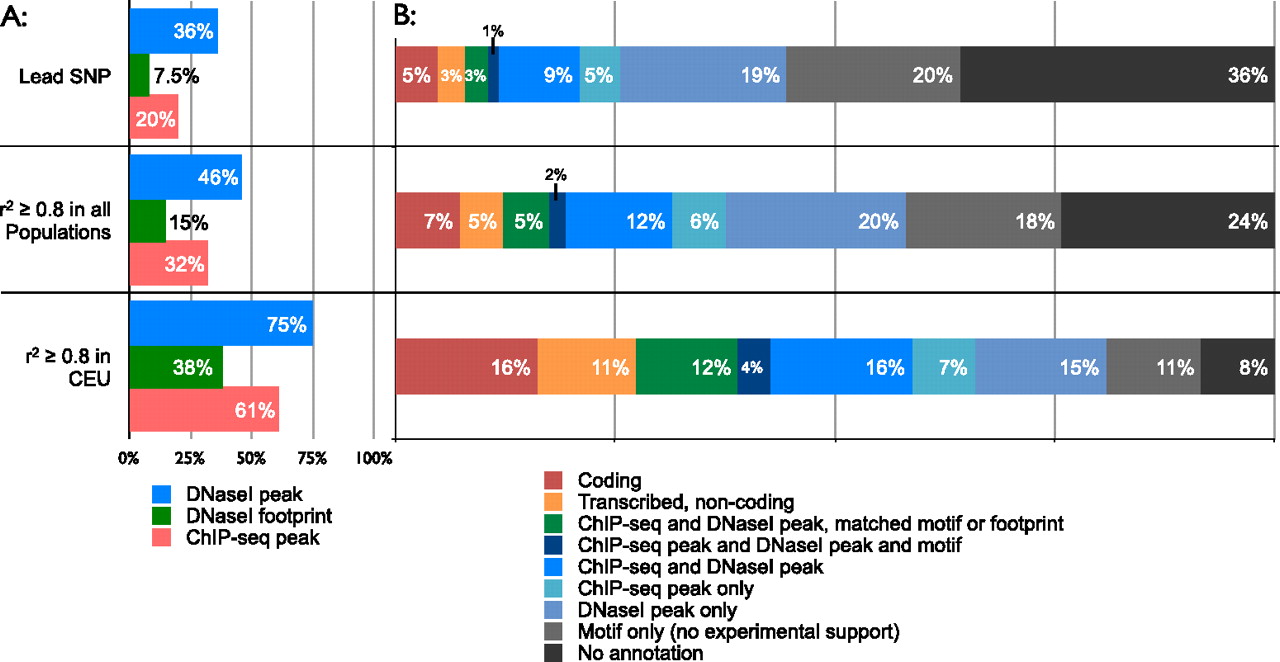
Proportions of associations for different types of functional data. Proportions are shown for individual assays (A) and for all sources of evidence combined (B). Proportions are presented separately for lead SNPs and SNPs in strong linkage disequilibrium (r2 ≥ 0.8) with a lead SNP. For each association, we determine which SNP in the LD region is most strongly supported by functional data in order to generate the proportions in panel B. We separately consider SNPs in strong linkage disequilibrium with a lead SNP in all HapMap 2 populations, and SNPs in strong linkage disequilibrium with a lead SNP in the CEU population. For the latter case, we use only associations identified in populations of European descent, and show that we can map 80% of these associations to a functional SNP supported by experimental ENCODE data.


