
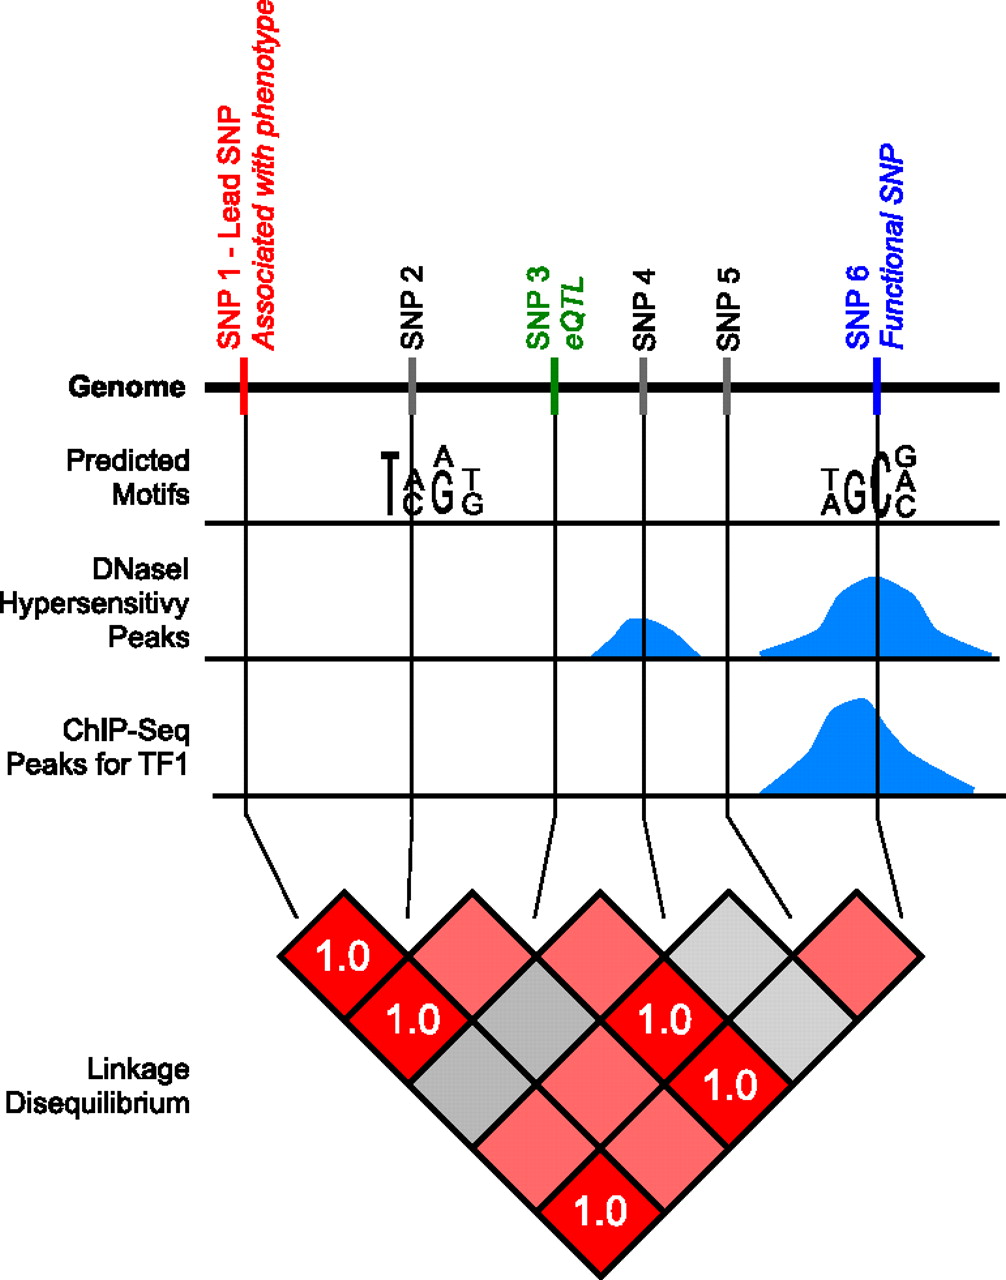
Schematic overview of the functional SNP approach. This figure illustrates the approach we use to identify functional SNPs. Three different types of regulatory data are represented for an area of the genome: motif-based predictions, DNase I hypersensitivity peaks, and ChIP-seq peaks. This region contains six SNPs. SNP1 is associated with a phenotype in a genome-wide association study. SNP3 is an eQTL associated with changes in gene expression in a different study. SNP6 overlaps a predicted motif, a DNase I hypersensitivity peak, and a ChIP-seq peak. There are, therefore, multiple sources of evidence that SNP6 is in a regulatory region. Furthermore, SNP6 is in perfect linkage disequilibrium (r2 = 1.0) with SNP1 and SNP3, meaning that there is transitive evidence due to the LD that SNP6 is also associated with the phenotype and is also an eQTL. SNP6 is therefore the most likely functional SNP in this associated region.


