
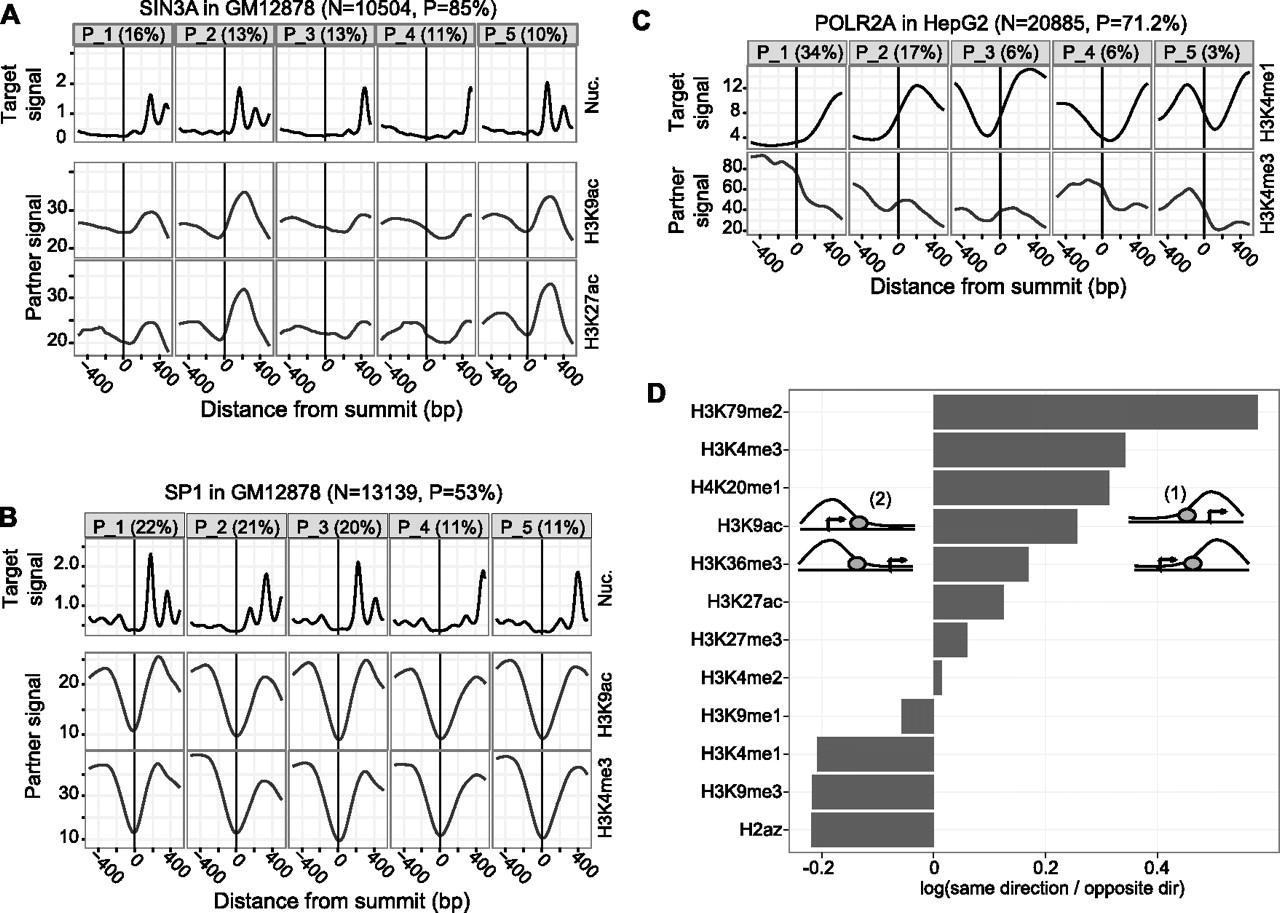
(A,B) The top row shows the most prevalent nucleosome positioning clusters around SIN3A and SP1 sites, respectively, in GM12878. The remaining rows show the signal of histone modifications, averaged over all sites in the corresponding clusters. TSS-proximal TFs, such as SIN3A, exhibit correlated nucleosome positioning and histone modification patterns. Such correlations, however, are not evident for TFs that tend to bind more distally from TSSs (e.g., SP1). (C) Clusters of H3K4me1 signal around POLR2A sites in HepG2 and the corresponding H3K4me3 signal. There is a clear anticorrelation between the two histone marks. (D) For all CAGT runs around TFBSs, we considered all TSS-proximal sites that were assigned to asymmetric clusters, and counted how many times the direction of transcription of the TSS closest to a site agreed with (configuration (1)) or opposed (configuration (2)) the direction of the asymmetry pattern (from low to high signal) of the cluster to which the site was assigned. We are showing the log10-ratio of the two counts, aggregated over all CAGT runs for the same mark. Values >0 (corresponding to ratios >1) imply that the mark tends to increase in the direction of transcription, while values <0 imply that the mark tends to increase in the opposite direction.


