
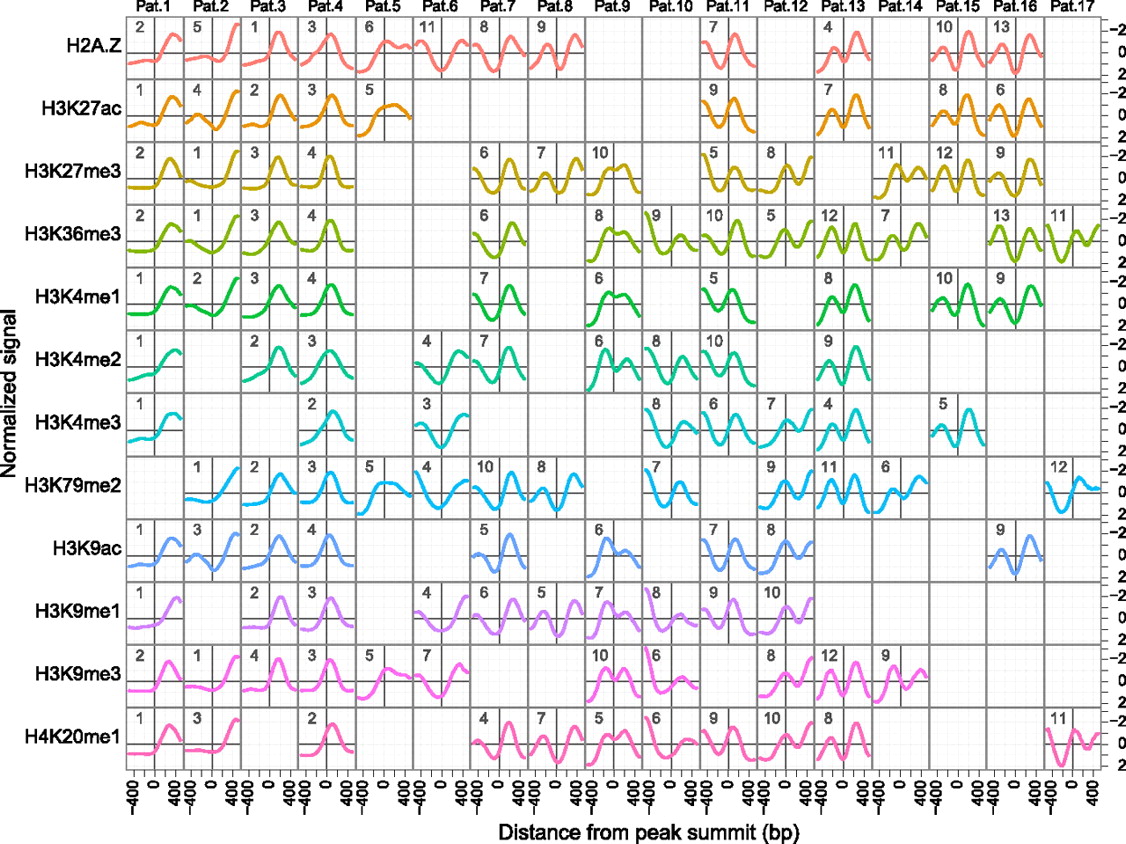
Figure 7.
CAGT meta-clusters for all histone modifications across all binding proteins in all Tier 1 and Tier 2 ENCODE cell lines. Each row contains the clusters discovered by CAGT in the merged data sets for the corresponding modification. The clusters for each mark are numbered according to their size, with cluster 1 for each mark containing the most TFBSs (see the numbers at the top, left corner of each shape plot). Clusters for different modifications are arranged to bring similar shapes in the same column. Five columns containing three or fewer shapes are not shown.


