
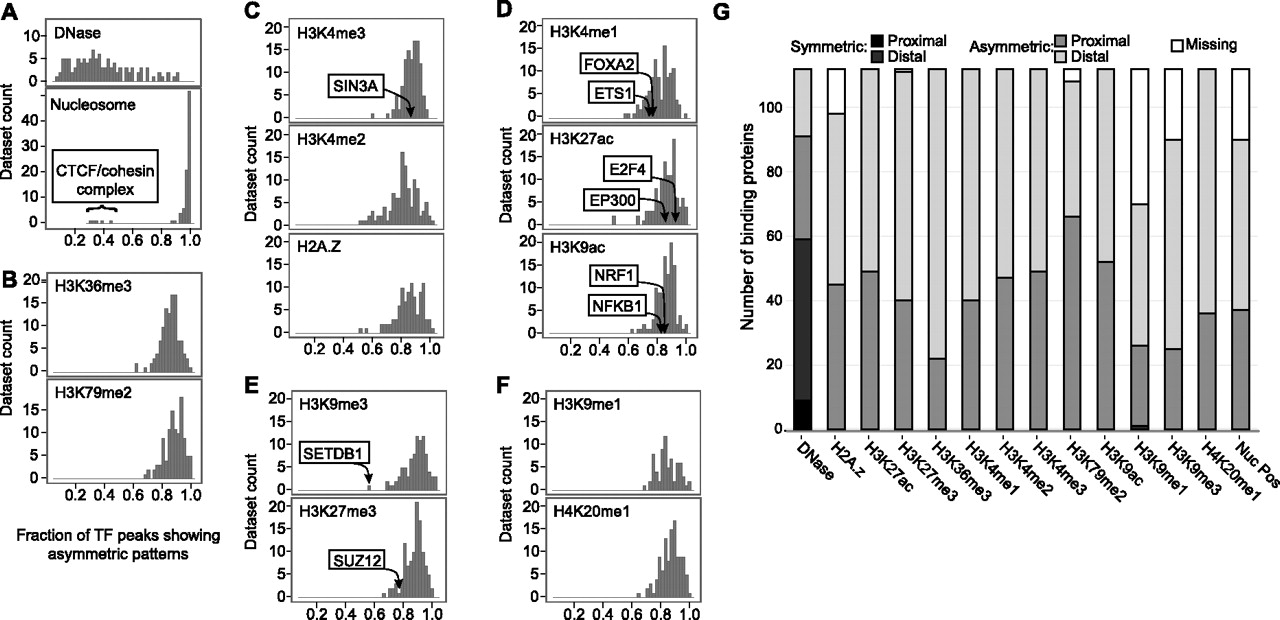
Widespread asymmetry of chromatin marks around TFBSs. (A–F) Fraction of TF peaks with asymmetric patterns for each chromatin mark. For each combination of TF and mark, we computed the fraction of high signal binding sites in asymmetric CAGT clusters. Results were averaged over all available data sets for the same TF and mark in all cell lines. Some examples for factors that contribute to the specific data point are shown, with arrows pointing to the asymmetry fraction of the factor. For example, in ∼85% of NRF1 binding sites with high H3K9ac signal, the shape of the modification is asymmetric around the binding site. (A) DNase and nucleosome positioning and their contrasting asymmetry frequency distributions. (B) Gene body marks. (C) Promoter-associated marks. (D) Enhancer-associated marks. (E) Repressive marks that exhibited moderate signal around binding sites. (F) Repressive marks that exhibited generally weak signal around binding sites. (G) For each combination of TF and mark, we computed the number of proximal and distal binding sites in symmetric and asymmetric CAGT clusters and identified which one of the four groups, symmetric proximal, symmetric distal, asymmetric proximal, and asymmetric distal, contained the largest number of binding sites. Results were averaged over all available data sets for the same TF and mark in all cell lines. The height of each bar shows the number of TFs for which the corresponding group was the most prevalent. The “Missing” part corresponds to the TFs that were not assayed for that mark.


