
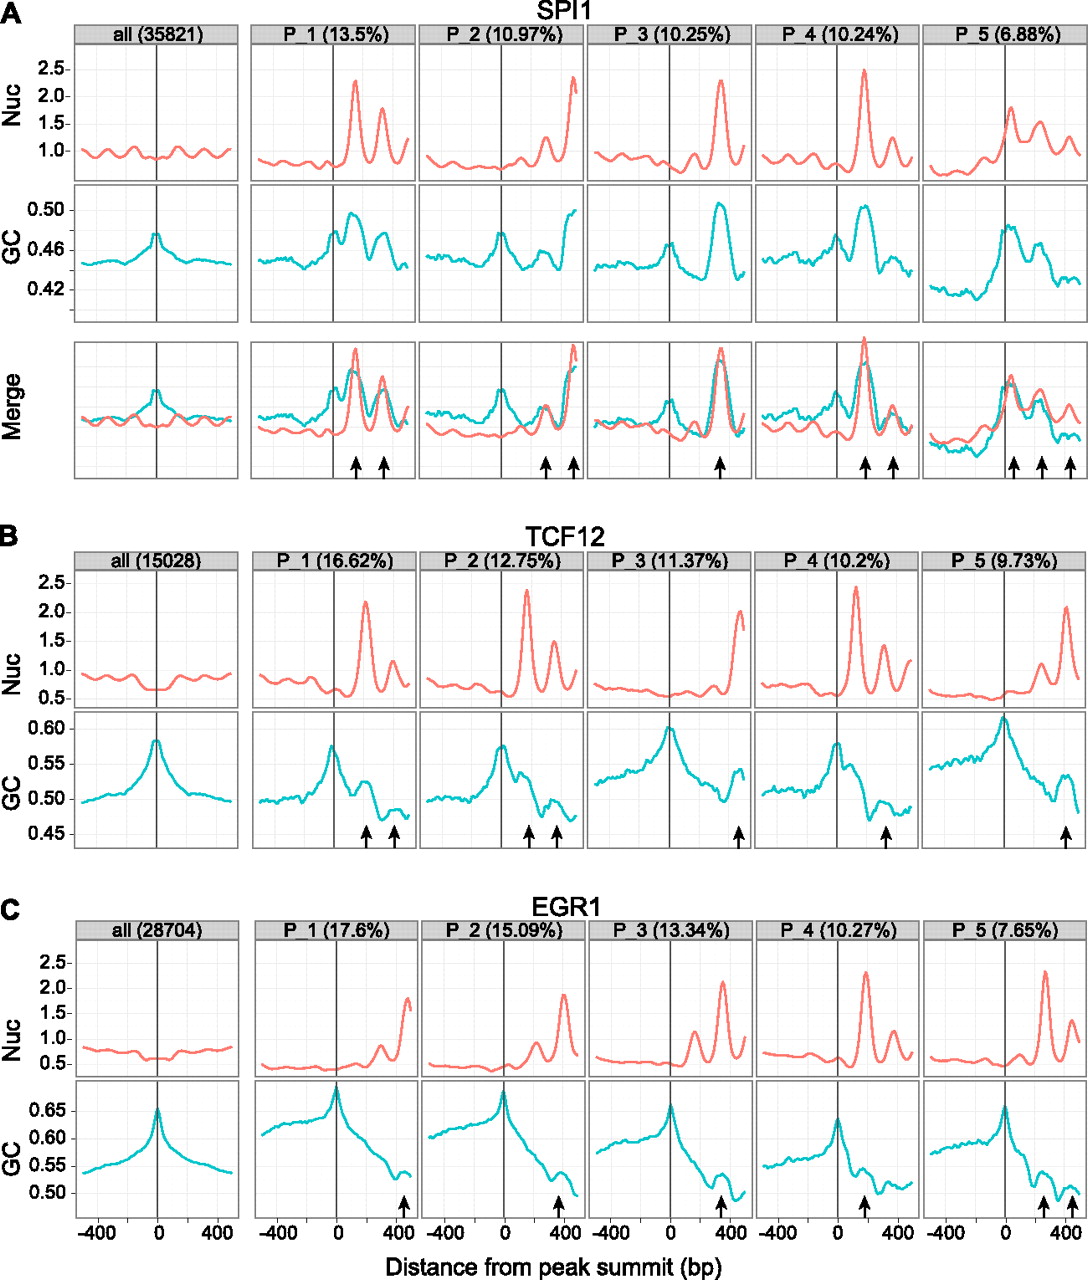
Examples of nucleosome positioning clusters around TFBSs and relationship to GC content. For each TF, the first panel of the top row is a traditional aggregation plot, where the signal is averaged over all sites. The total number of sites is shown in the header. The remaining panels of the top row show the mean nucleosome positioning signal in the five largest clusters discovered by CAGT, with the fraction of peaks in each cluster shown in the header. Each panel in the second row shows the mean GC content of all sites used in the panel above it. If a site was “flipped” during the last step of CAGT (see Fig. 1), then the corresponding GC signal was also flipped accordingly. GC content was computed using a sliding window of 21 bp. The small arrows indicate container sites. (A) SPI1 in GM12878; (B) TCF12 in GM21878; (C) EGR1 in K562.


