
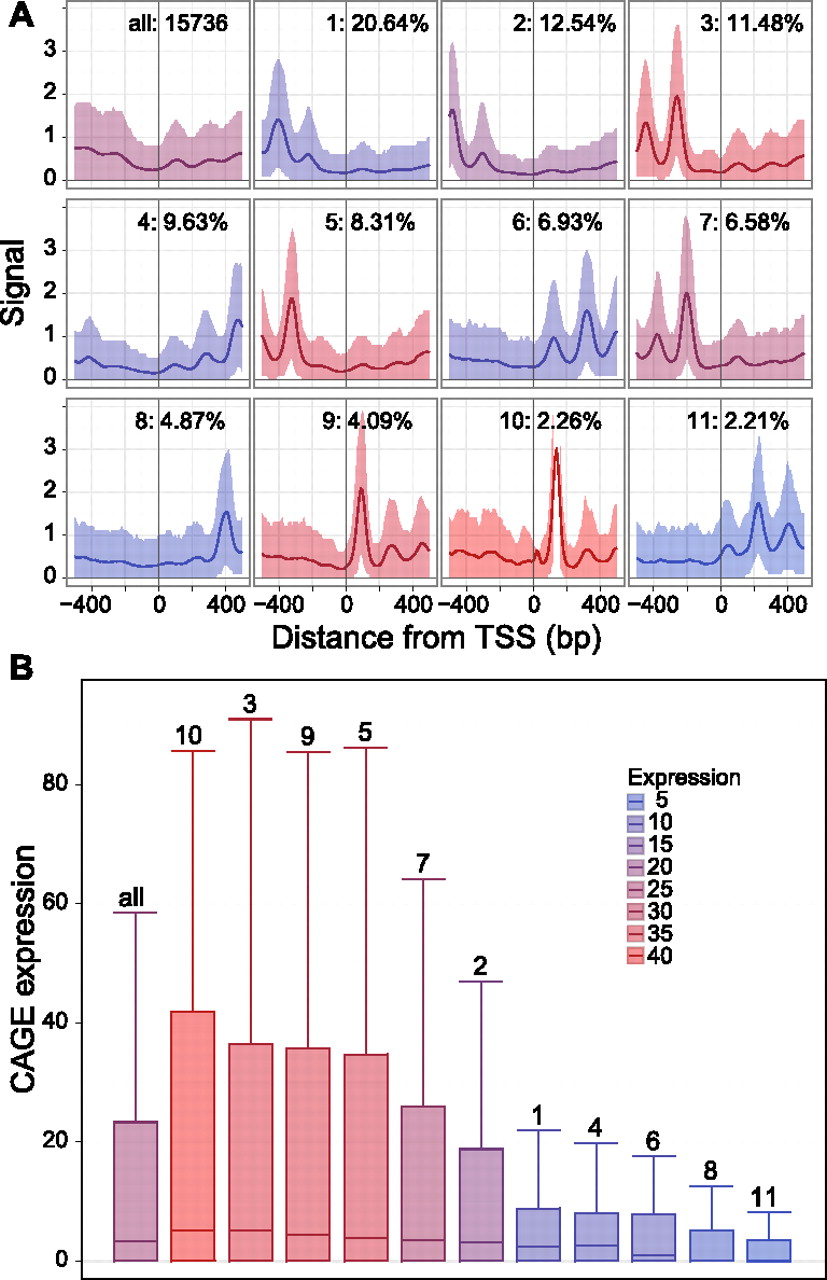
(A) Nucleosome positioning patterns around TSSs in K562. The first panel is a traditional aggregation plot of the nucleosome positioning signal in a window of size 1001 bp centered on each of 15,736 GENCODE TSSs. The bold line is the mean signal across all TSSs, while the shaded area around it corresponds to the 10th and 90th percentiles. The rest of the panels show the patterns uncovered by CAGT, ordered by the percentage of TSSs that follow each pattern. Patterns corresponding to <2% of TSSs are not shown. All TSSs are reoriented so that the direction of transcription is from left to right. Plots are colored according to the third quartile of the expression of TSSs in the corresponding cluster, as measured by CAGE tags. (B) Box-plots of the expression of TSSs following each of the patterns shown in A.


