
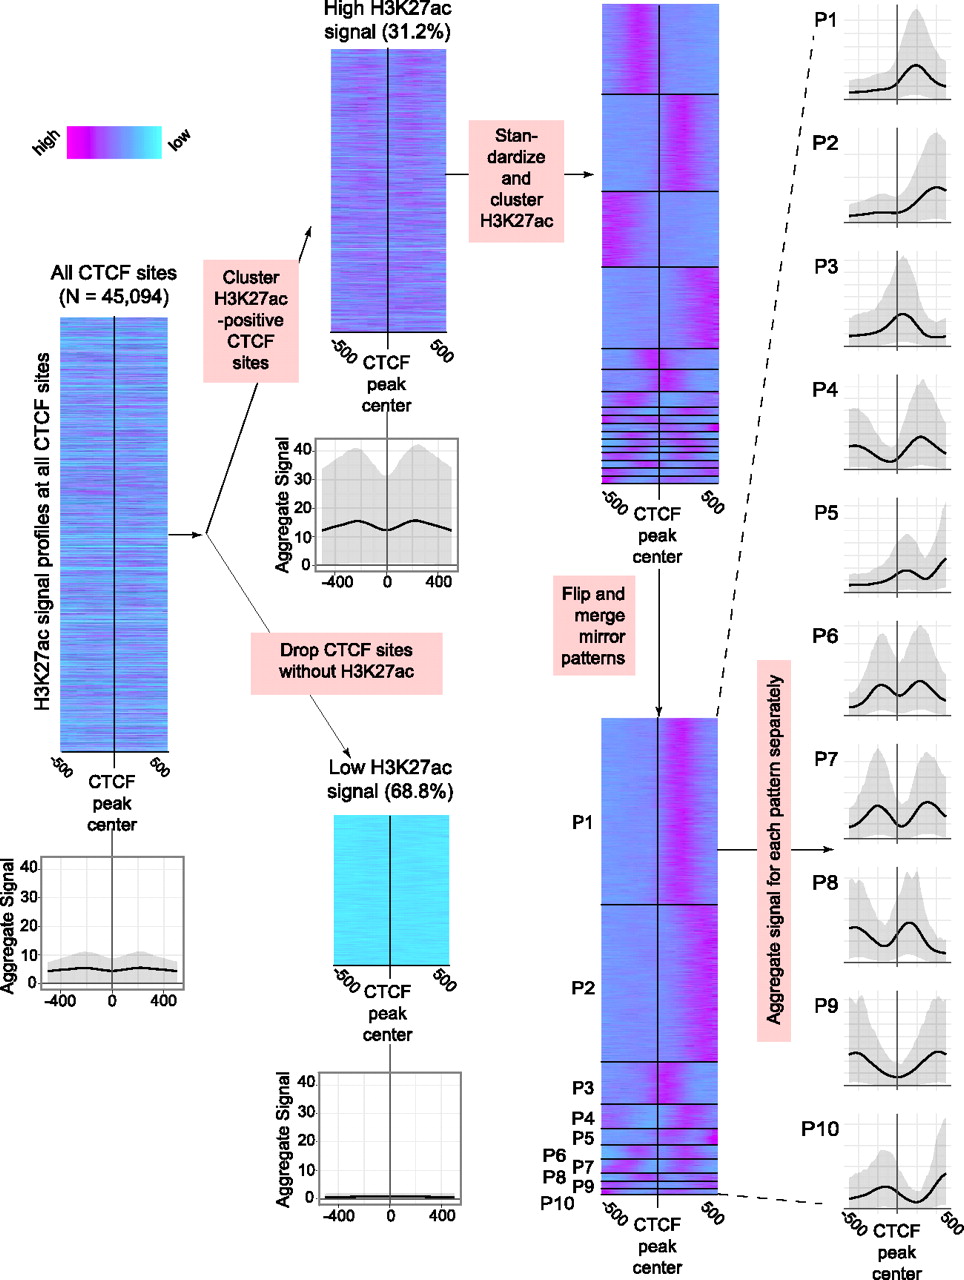
Schematic of the steps followed by CAGT in order to group the signal profiles around a set of genomic features into distinct and coherent clusters. The steps are illustrated using H3K27ac signal profiles around CTCF binding sites in the K562 cell line. (1) We start by extracting the H3K27ac signal intensity profiles in a window (±500 bp) around each feature (CTCF binding site) and aligning all signals at the core of the feature (summit of the CTCF peak). The grayscale plot at the bottom is a traditional aggregation plot obtained by averaging all signal profiles. The bold line is the mean intensity, while the shaded area around it corresponds to the 10th and 90th percentiles of the signal. (2) The sites are divided into high and low signals based on the peak intensity of each H3K27ac signal profile around each site. (3) High signal sites are standardized to zero mean and unit standard deviation and clustered with the k-medians algorithm. This step typically leads to a large number of compact clusters, some of which may be redundant with similar average patterns. (4) In the final step, similar clusters, as well as clusters that are mirror images of each other, are merged using hierarchical agglomerative clustering, resulting in a small number of distinct, nonredundant, compact clusters (see Methods for details).


