
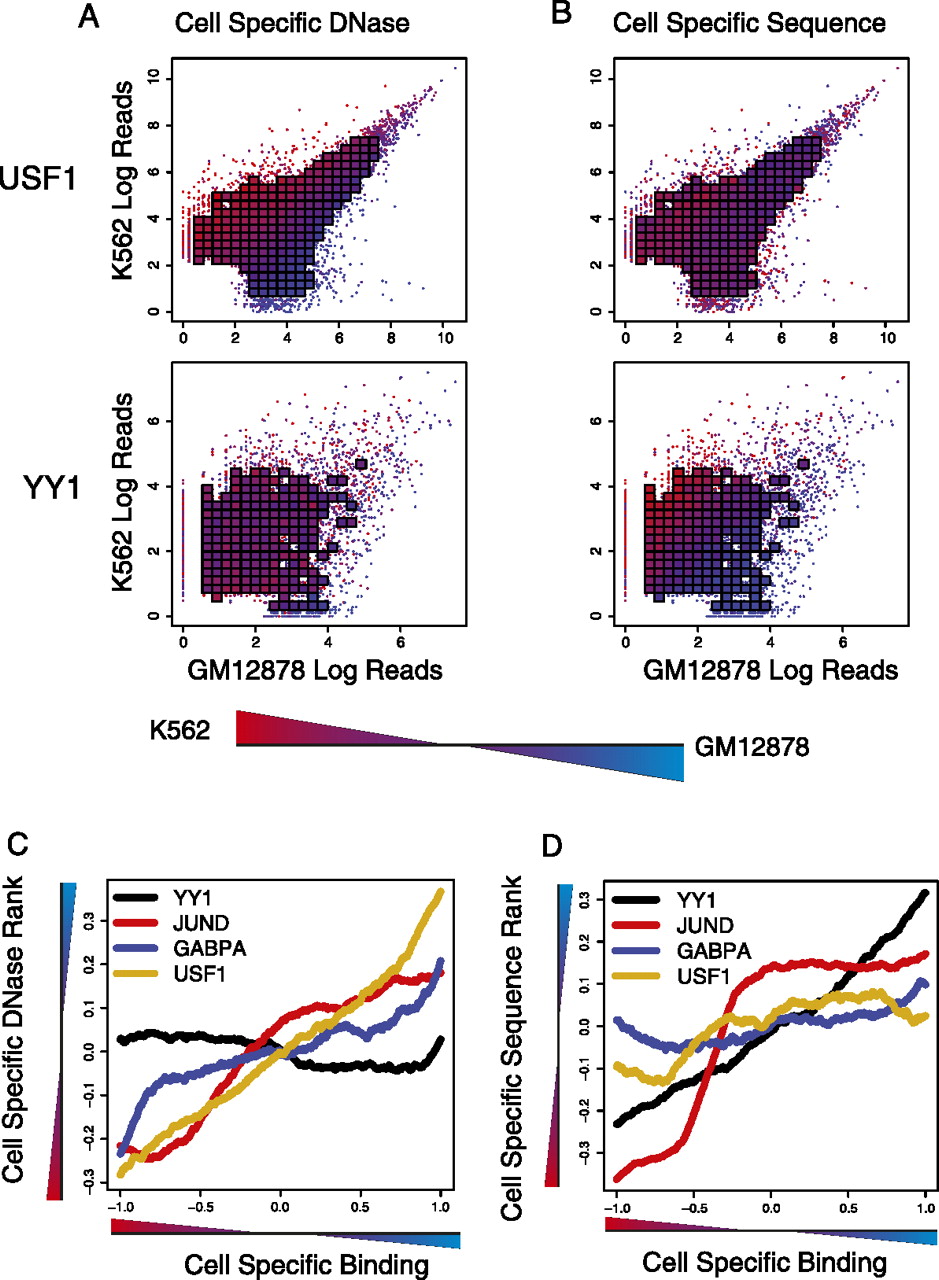
Cell-type–specific TF binding is associated with differential DNase accessibility, sequence signal, or both. (A) Differential DNase accessibility (color) is shown for K562 versus GM12878 with respect to cell-type–specific binding (x-axis for GM12878; y-axis for K562). Each point represents a single binding site, and if there are a sufficient number of points in a region, their value is averaged and appears as a square. DNase accessibility, as measured by read-counts, for USF1 (top) correlates with cell-specific binding. This contrasts with YY1 (bottom), where DNase accessibility is evenly distributed across cell-type–specific and nonspecific peaks. (B) Differential sequence preference (color) is shown for K562 versus GM12878. k-mer SVM models are learned from K562 and GM12878 binding sites, and their differential scores are shown by color gradient. For YY1, but not USF1, we see that the differential k-mer SVM scores distinguish cell-type–specific binding sites. (C) Binding sites with differential TF occupancy also have differential DNase accessibility. Each line represents a TF that has been assayed in GM12878 and K562. The x-axis plots a ranking from the most K562-specific binding site to the most GM12878-specific binding sites, based on cell-to-cell log read count ratios, while the y-axis shows the difference in DNase-accessibility ranks in GM12878 and K562. The line plot is smoothed using the mean over a window of 500 binding sites. (D) For the same TFs, we plot the difference in K562- and GM12878-specific k-mer SVM score ranks (y-axis) as a function of the ranking of cell-to-cell log read count ratios, from the most K562-specific binding site to the most GM12878-specific binding sites. The line plot is smoothed using the mean over a window of 500 binding sites.


