
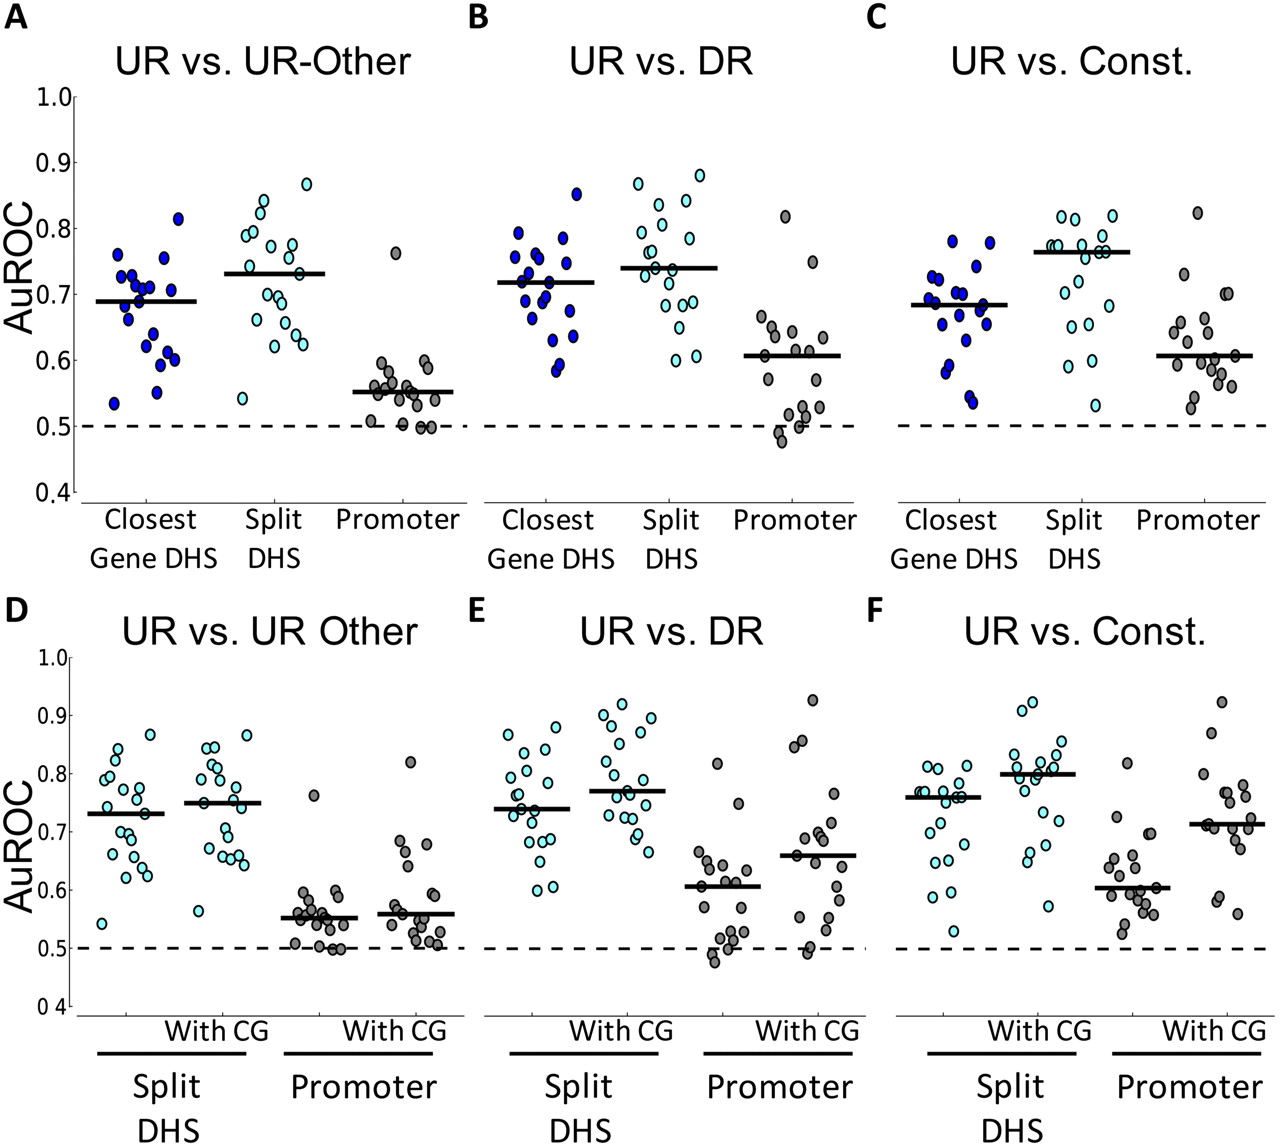
Classifier performance for various classification tasks. (A–C) Performance of the classifier using all PWMs. Each figure compares the performance of two methods of associating DHSs to genes (Closest Gene DHS and Split DHS) with the proximal promoter. The solid black lines across the dots indicate the median. Across all figures, the promoter sequence classifier does not perform as well as the performance achieved by using Closest Gene DHS and Split DHS and is significant at the 0.05 level (paired t-test). (D–F) Impact of normalized CG dinucleotide content on classifier performance. Results using the Split DHS and promoter sequence are shown. Without CG, columns are the same as in A–C. All figures show average results from five iterations of fourfold cross-validation. The dotted line indicates an AuROC of 0.5, which is the performance of a random classifier.


