
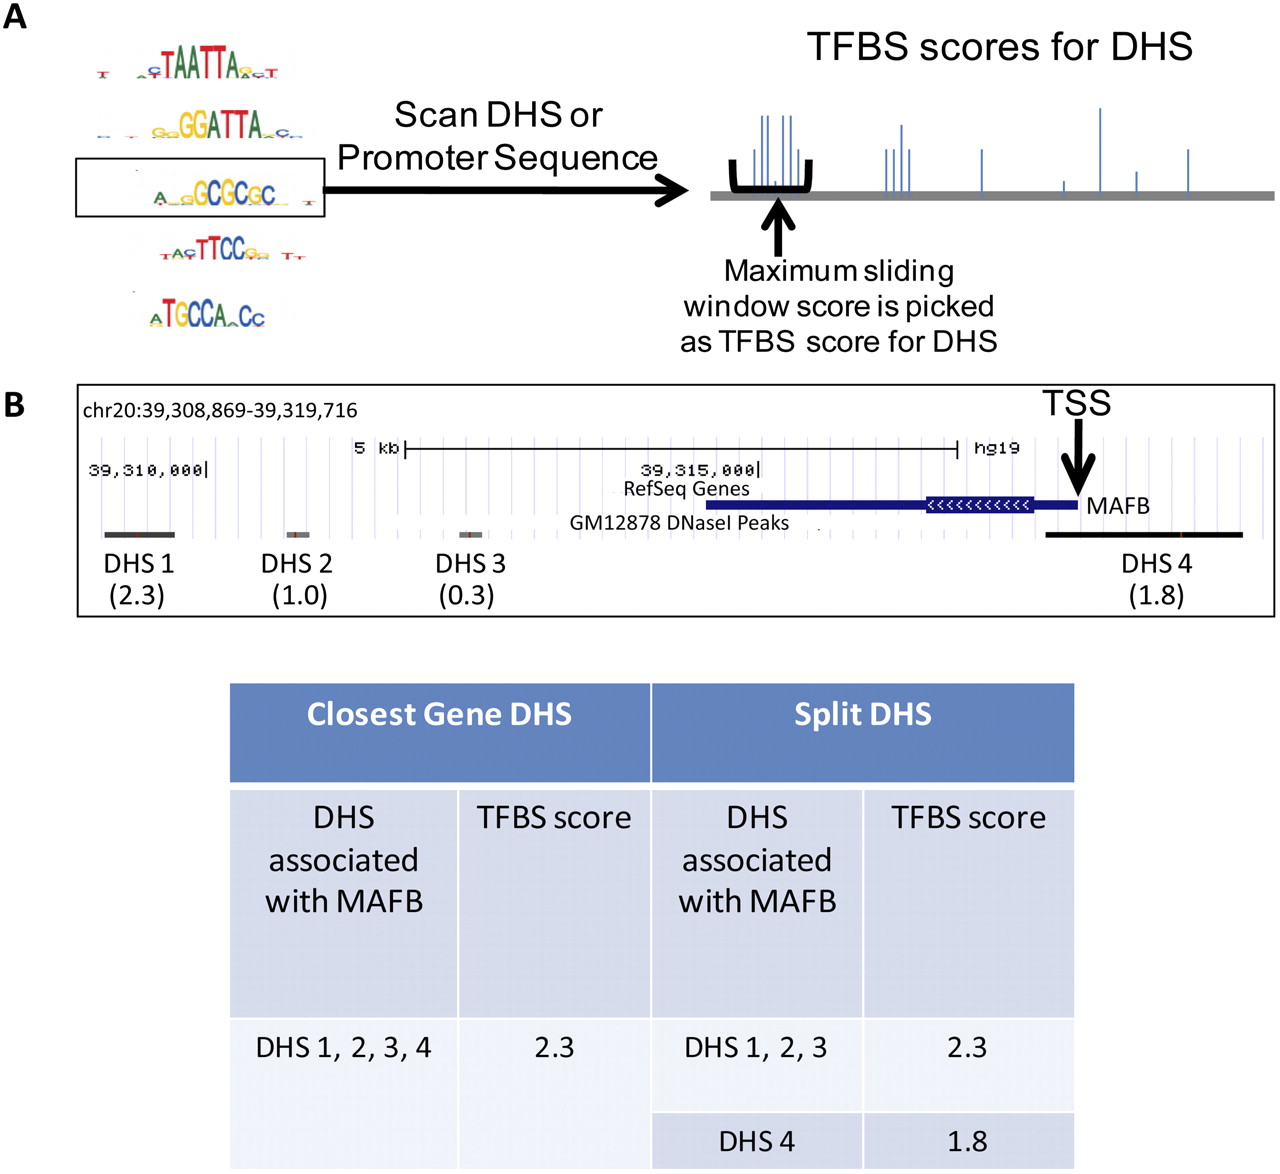
Transcription factor binding site features. (A) DHS and promoter sequences are scanned with PWMs. TFBS scores are log-likelihood ratios of PWM over the background model. A sliding window is used to identify the score for each DHS or promoter. (B) Example to show association of DHSs with genes. Numbers in the brackets are example TFBS scores for the DHS for a specific DHS. Two methods of association were used. In closest gene DHS, DHSs 1–4 from the GM12878 cell line are associated with the gene MAFB. For the TF in consideration, the maximum of all TFBS scores is 2.3. In Split DHS, we separated DHSs overlapping the TSS and other DHSs. This resulted in two features for each gene for each TF.


