
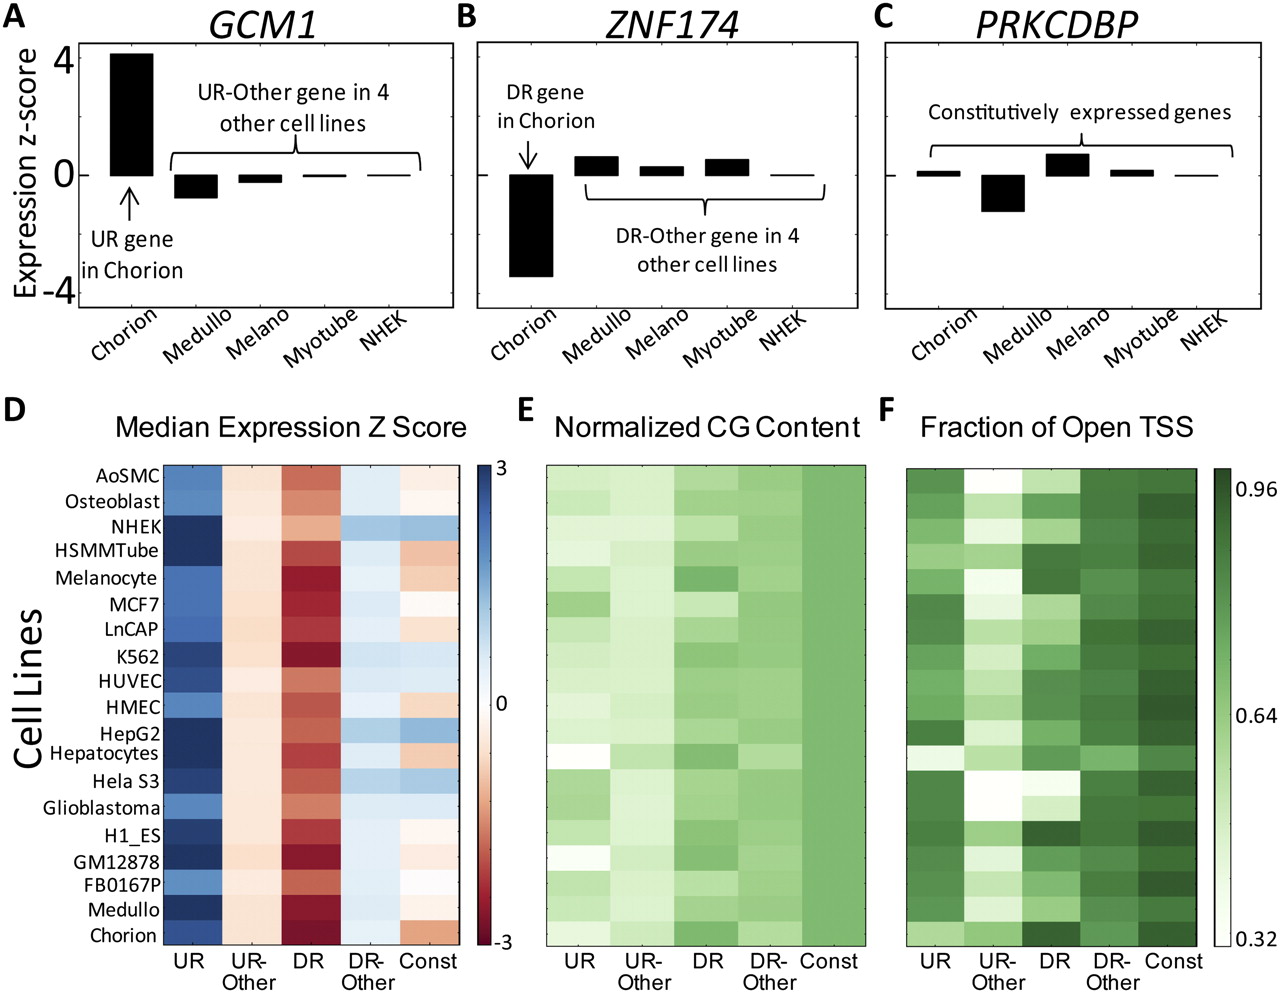
Cell-type–specific gene expression and definition of gene classes. (A–C) Representative examples of different patterns of gene expression. Note that Z-score values are calculated from expression across all 19 cell lines. (A) A gene where the expression is specifically up-regulated in the first cell line (UR gene). (B) A gene that is specifically down-regulated in the first cell line (DR gene). (C) A gene that has low variability in expression (constitutively expressed gene). (D) Median expression Z-scores for the genes in each set in each cell line. (E) Normalized CG content from the promoter regions of genes. (F) The fraction of TSS in each gene set that were in a region of open chromatin. E and F share the same color map.


