
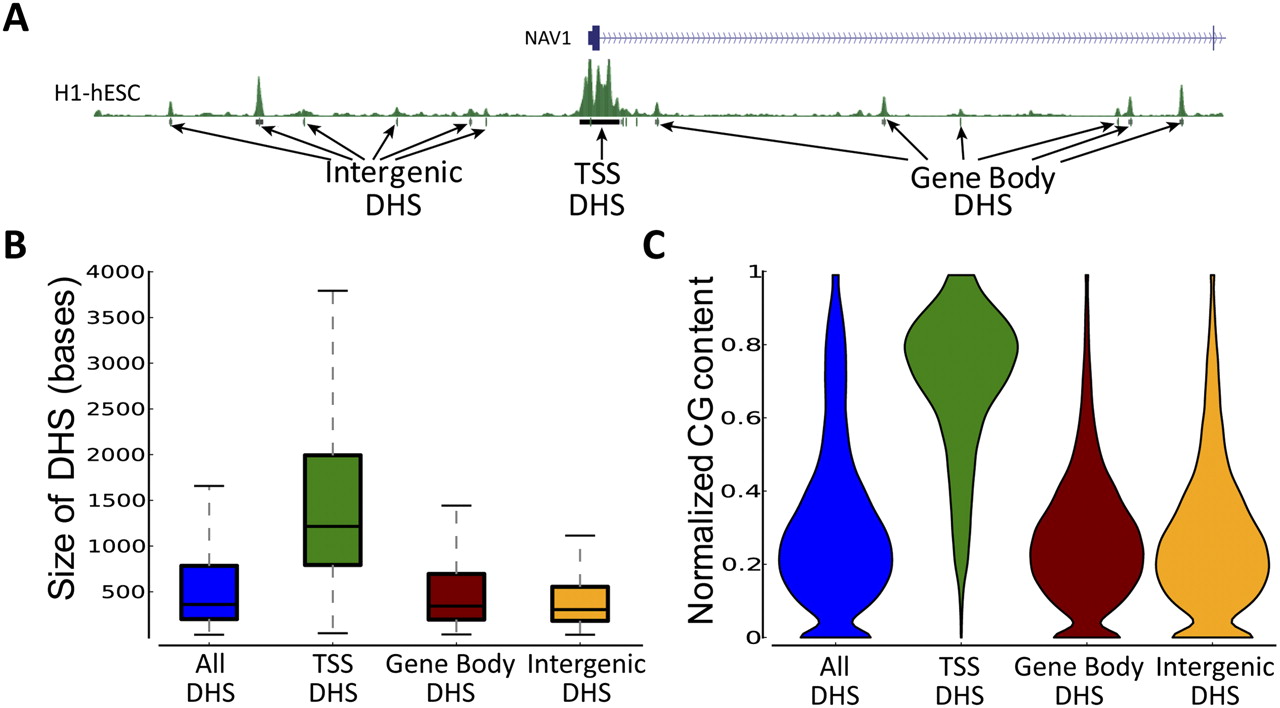
Figure 1.
Properties of DHS based on genomic location. (A) DHSs that are intergenic and those that are overlapping the TSS and gene body were classified as Intergenic, TSS, and Gene Body DHSs, respectively (Chr1: 201,566,484–201,683,121). (B) Sizes of different DHSs for the Chorion cell line. Data from only one cell line were used to avoid multiple counting of ubiquitous DHSs. Other cell lines show similar trends. Outliers are not plotted. (C) Violin plot showing normalized CG content for different DHSs in the Chorion cell line. The subset of DHSs with a normalized CG content of zero is comparatively small (median of 128 bp).


