
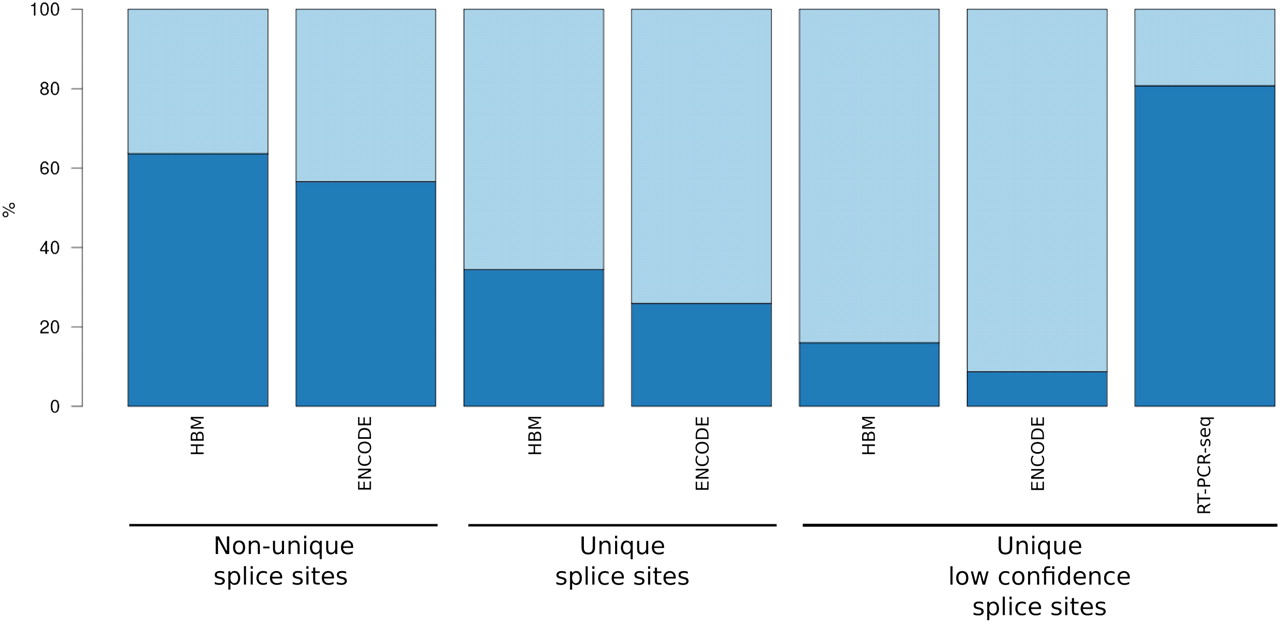
Comparison of validation rates. Validation rates (dark blue) of GENCODE non-unique splice junctions (i.e., common to more than one GENCODE transcript isoform; “common” junctions), GENCODE unique splice junctions (specific to a single GENCODE transcript isoform; “specific” junctions), and lower confidence GENCODE unique splice junctions (specific to a single novel or putative GENCODE transcript isoform; “specific and low expressed” junctions) by Illumina Human Body Map RNA-seq (HBM), ENCODE RNA-seq (ENCODE), and RT-PCR-seq are shown in bar plot format. Exon–exon junctions were considered substantiated by a RNA-seq data set if they were overlapped by at least two split-reads (Methods). The criteria used to validate a junction by RT-PCR-seq are detailed in the main text and schematized in Figure 1C. Note that both RNA-seq data sets fail to corroborate a substantial fraction of the rare and lowly expressed junctions when compared with RT-PCR-seq.


