
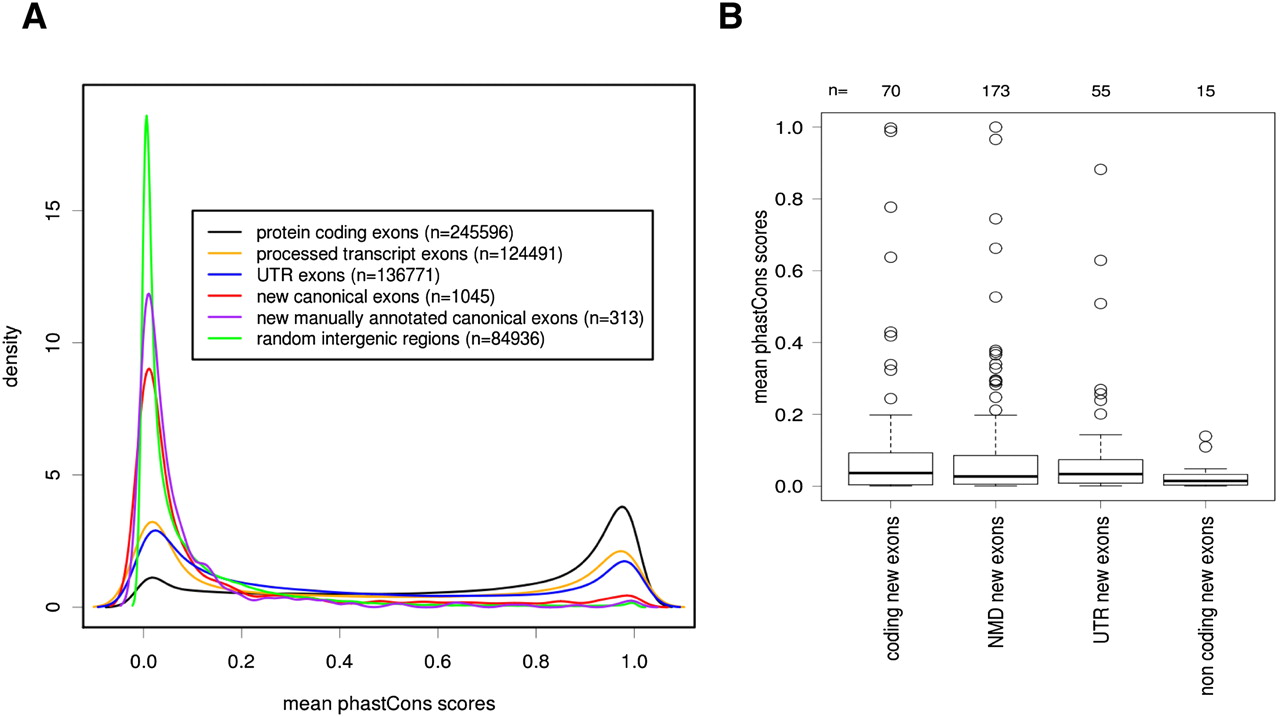
Conservation of newly identified exons. The conservation of the newly identified exons was assessed by comparing the distribution of phastCons scores of different genomic elements. The higher the phastCons score, the greater is the probability for a given element to be under negative selection. (A) Distribution of the mean phastCons scores of protein-coding exons (black line), noncoding (processed transcript) exons (yellow), UTR exons (blue), new canonical exons identified in this study (red), new canonical exons identified in this study, and mapping to protein-coding loci (purple) and random intergenic regions (green). (B) Boxplot distribution of the mean phastCons scores of new canonical exons identified in this study and mapping to protein-coding loci split per functional classes: protein coding, NMD (transcript subject to Nonsense Mediated Decay), UTR, and noncoding (see Methods).


