
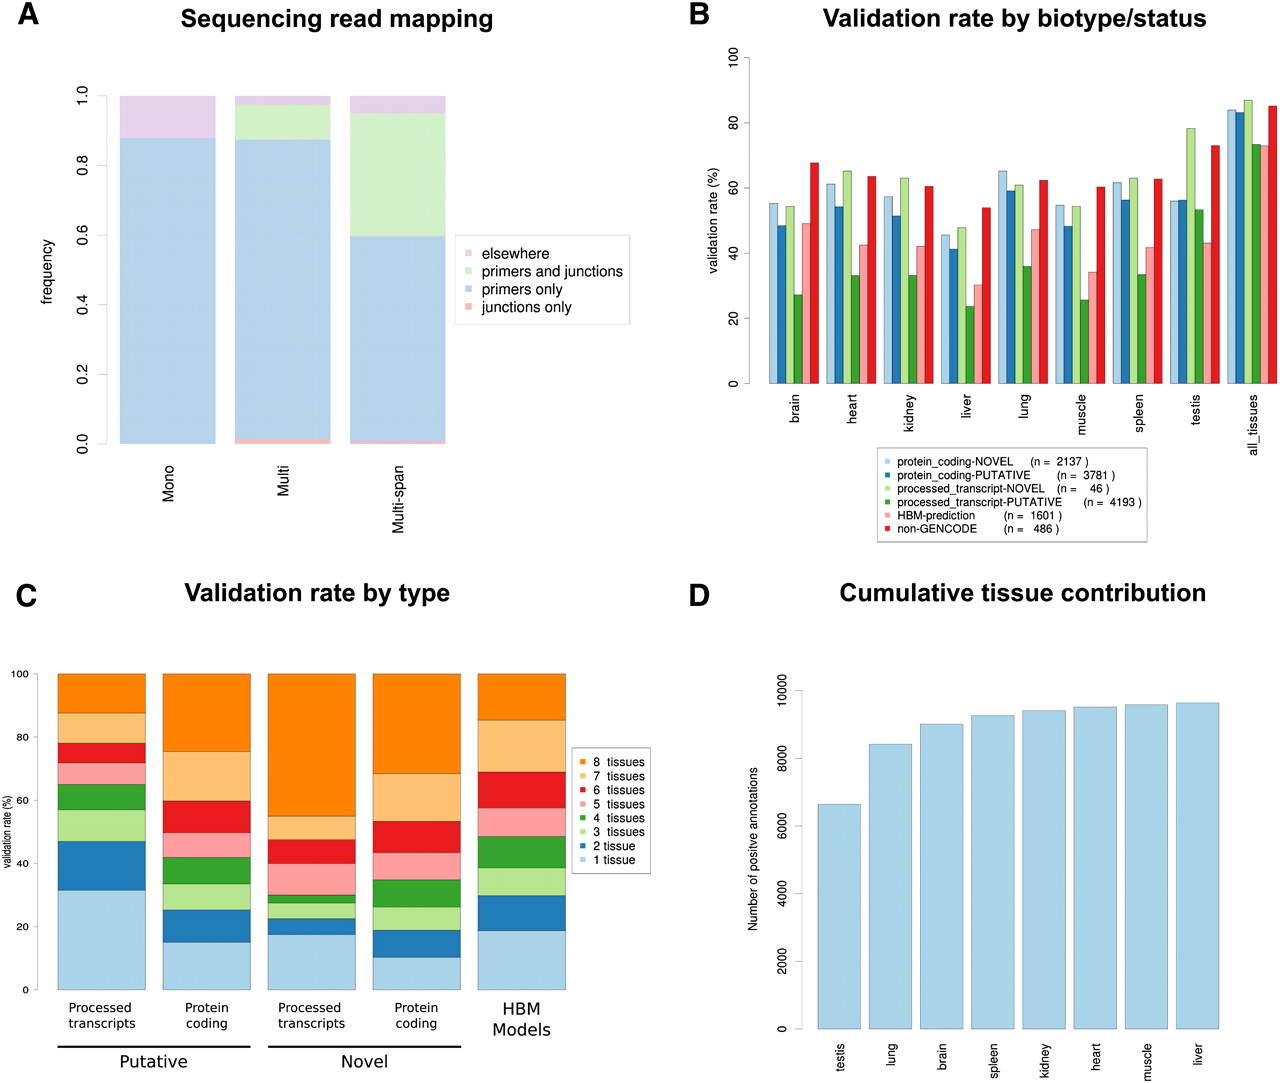
Validation rate of GENCODE and HBM gene models by RT-PCR-seq. (A) Mapping distribution of the sequencing reads obtained by RT-PCR-seq of gene models belonging to the “Mono,” “Multi,” and “Multi-span” categories (see text and Fig. 1B for details). (B) Validation rate of “novel” and “putative” GENCODE models (e.g., NOVEL processed transcripts) by biotype and status, of ENCODE Consortium predicted models (“non-GENCODE”) and of models inferred from the Illumina Human Body Map RNA-seq effort (HBM-prediction) for each assessed tissue and all tissues together (far right). The corresponding statistics, in particular, results for biotypes/statuses with few tested models such as “NOVEL nonsense mediated decay” and “NOVEL retained intron,” are presented in Supplemental Table S2. (C) Numbers of tissues in which validated GENCODE gene models (NOVEL protein coding, NOVEL processed transcripts, PUTATIVE processed transcripts, and PUTATIVE protein coding) and HBM models are detected. (D) Cumulative number of validated GENCODE gene models and HBM predictions in the eight assessed tissues.


