
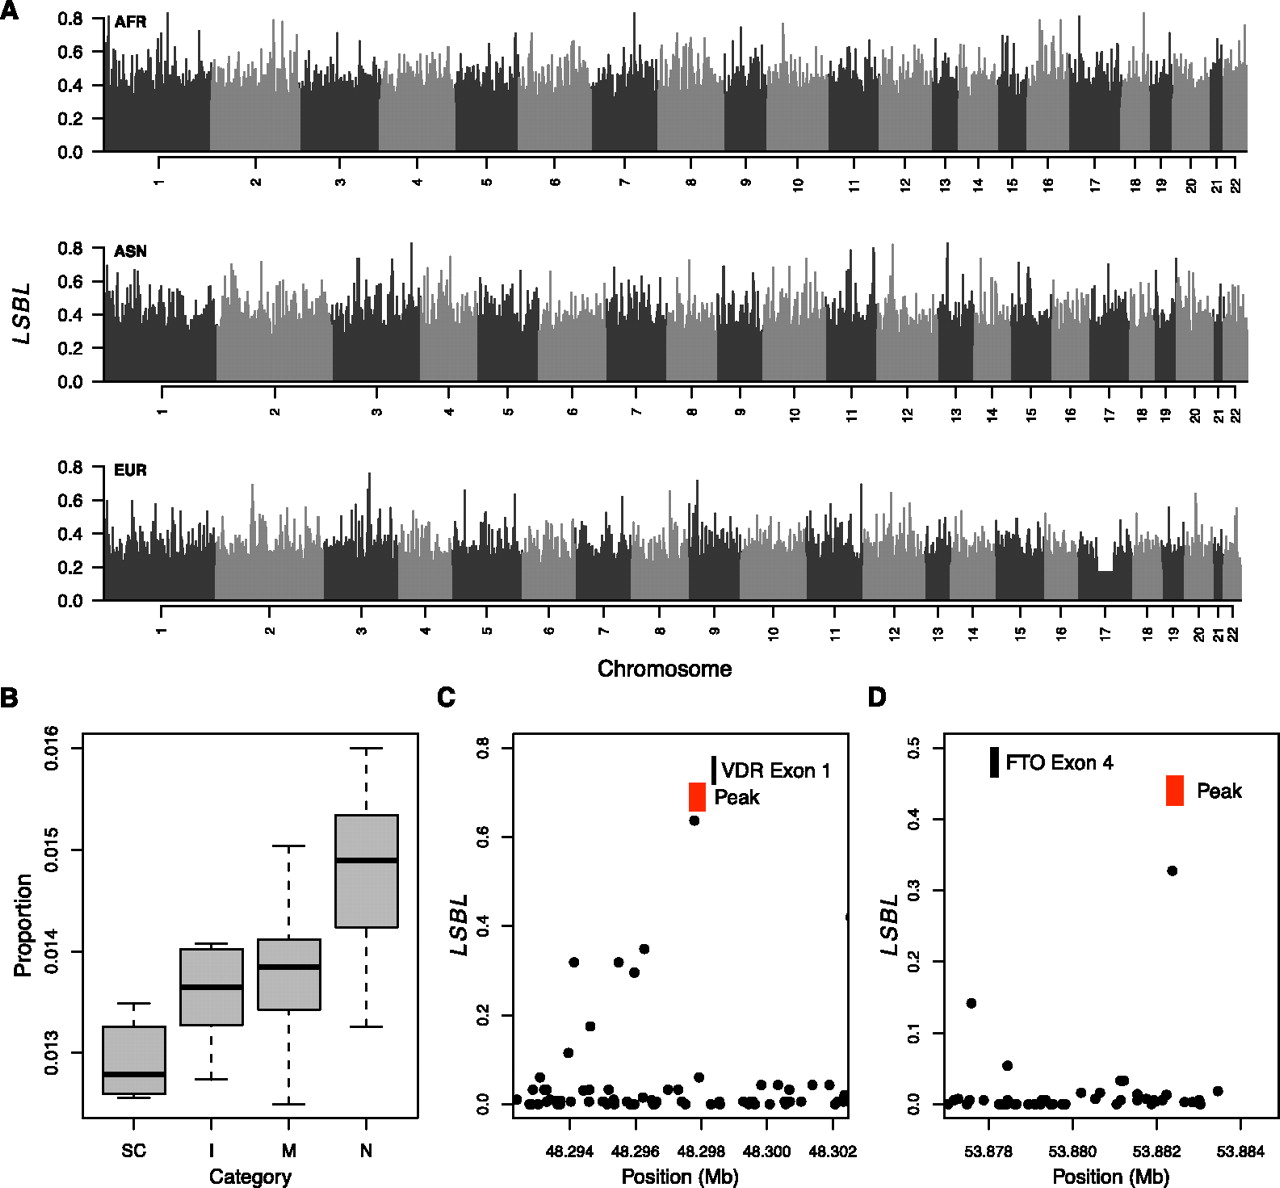
Genome-wide distribution of population structure in regulatory DNA. (A) Genome-wide distribution of locus-specific branch lengths (LSBLs) for Africans, Asians, and Europeans, respectively. Note that the valley of uniform LSBL on chromosome 17 in Europeans corresponds to the MAPT region that is segregating a large chromosomal inversion (Zody et al. 2008). (B) Distribution of the proportion of highly differentiated DNase I peaks found for different categories of cell types. (SC) Stem cells (iPS/ES); (I) immortalized; (M) malignant; (N) normal/primary cell types. (C) Distribution of African LSBL across intron 1 of VDR. (D) Distribution of European LSBL across intron 4 of FTO. In panels C and D, peaks are shown as red rectangles and exons as black rectangles.


