
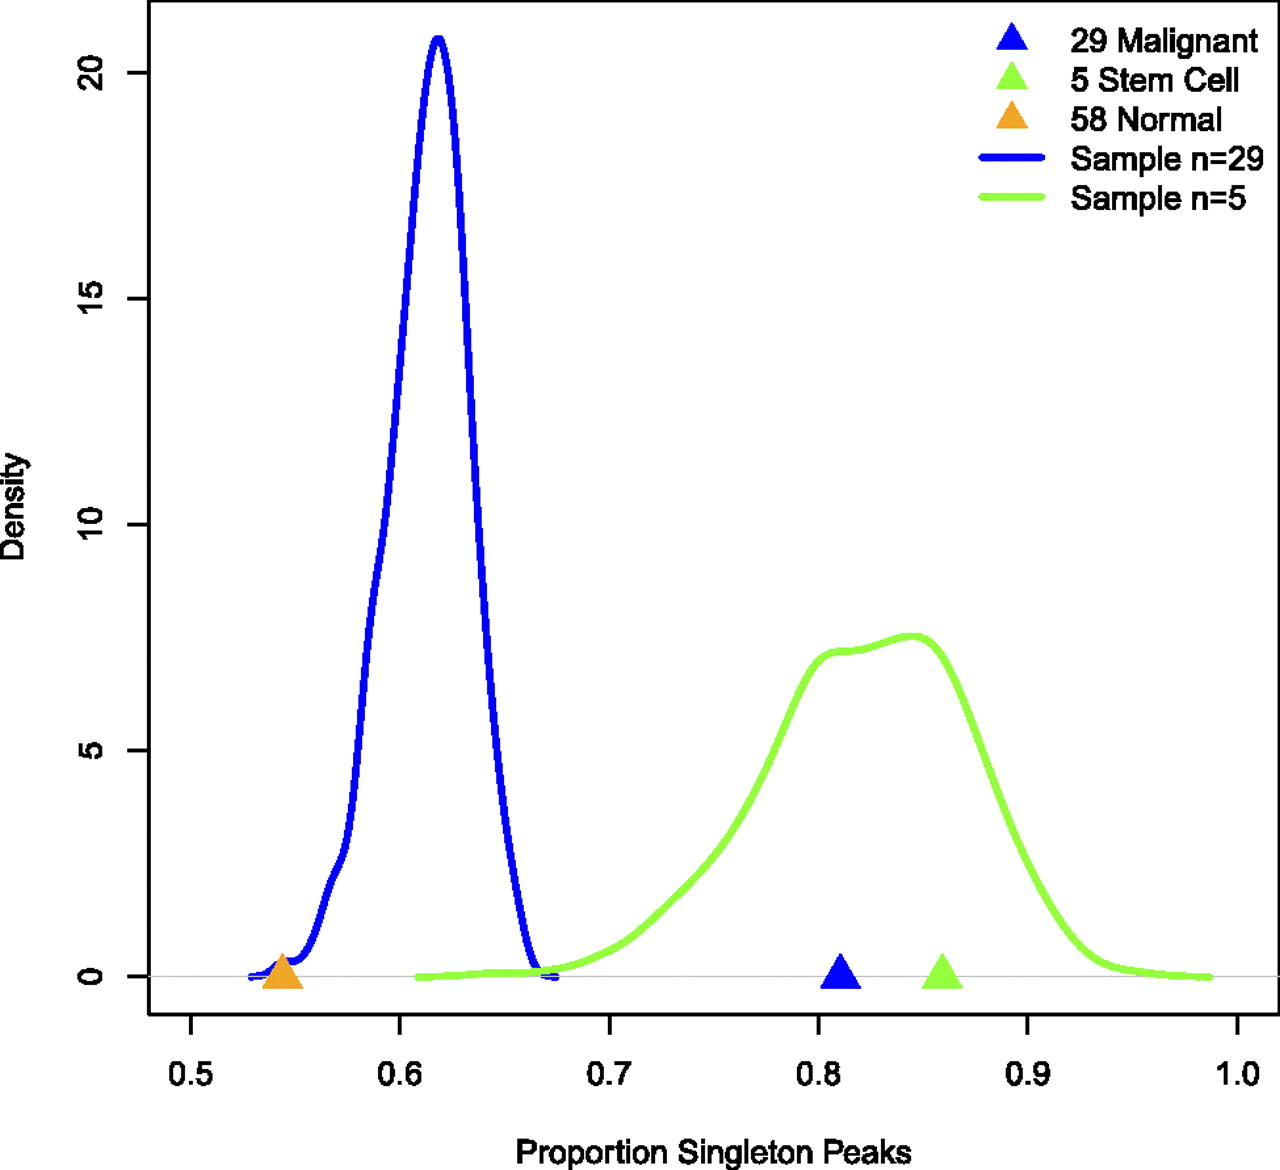
Figure 5.
Malignant cell lines exhibit significantly more singleton DNase I peaks than normal cell lines. (Triangles) Observed proportion of singleton peaks. (Blue and green lines) Distribution (density histograms) of singleton peaks when randomly sampling 29 (blue) or five (green) cell types; this is the distribution of the number of singleton peaks we would expect if malignant or stem cells were similar to normal cells, respectively. Note the malignant category (blue) shows significantly more singleton peaks than expected given its sample size, but the stem cell category (green) falls within the expected range.


