
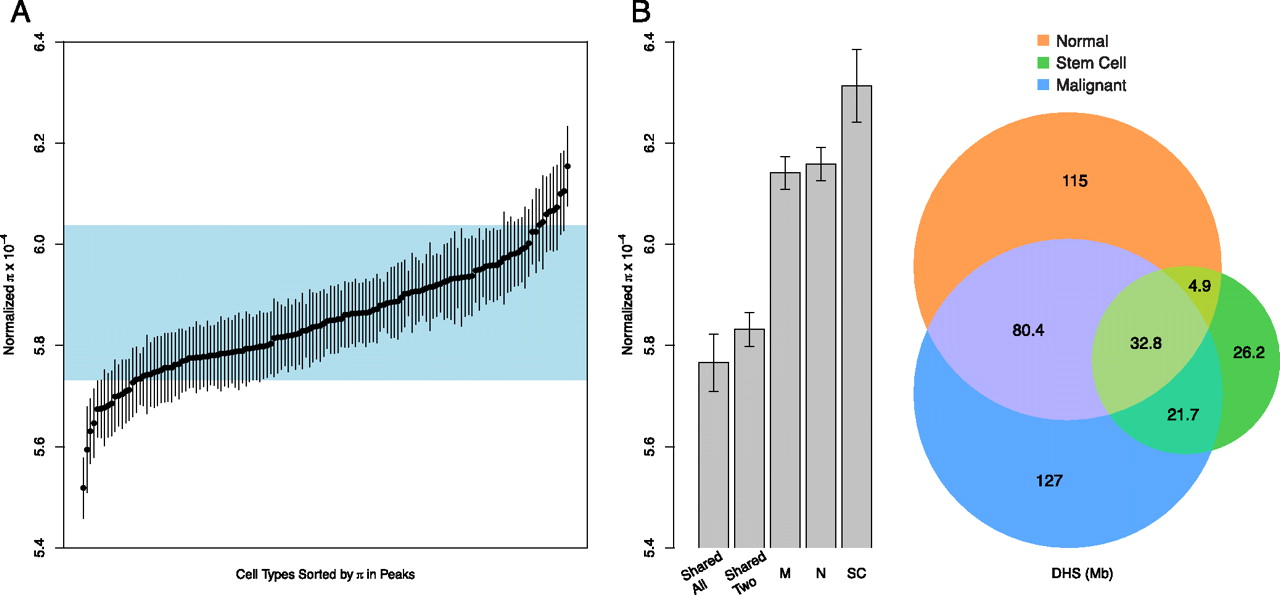
Heterogeneity of polymorphism across cell types. (A) Distribution of normalized nucleotide diversity (black points) across DNase I peaks in 138 cell types. Vertical bars around peaks indicate 95% confidence intervals obtained by bootstrapping. (Blue rectangle) 95% confidence interval for normalized nucleotide diversity in fourfold degenerate sites. (B) Venn diagram showing the amount of shared and unique sequence for DNase I peaks among normal/primary, malignant, and iPS/ES cell types. The barplot on the left shows average normalized diversity for several categories of peaks in the Venn diagram. Shared all and shared two denote peaks shared among all three categories and between any two categories, respectively. N, M, and SC denotes peaks specific to normal/primary, malignant, and stem cell (iPS/ES) cell types, respectively.


