
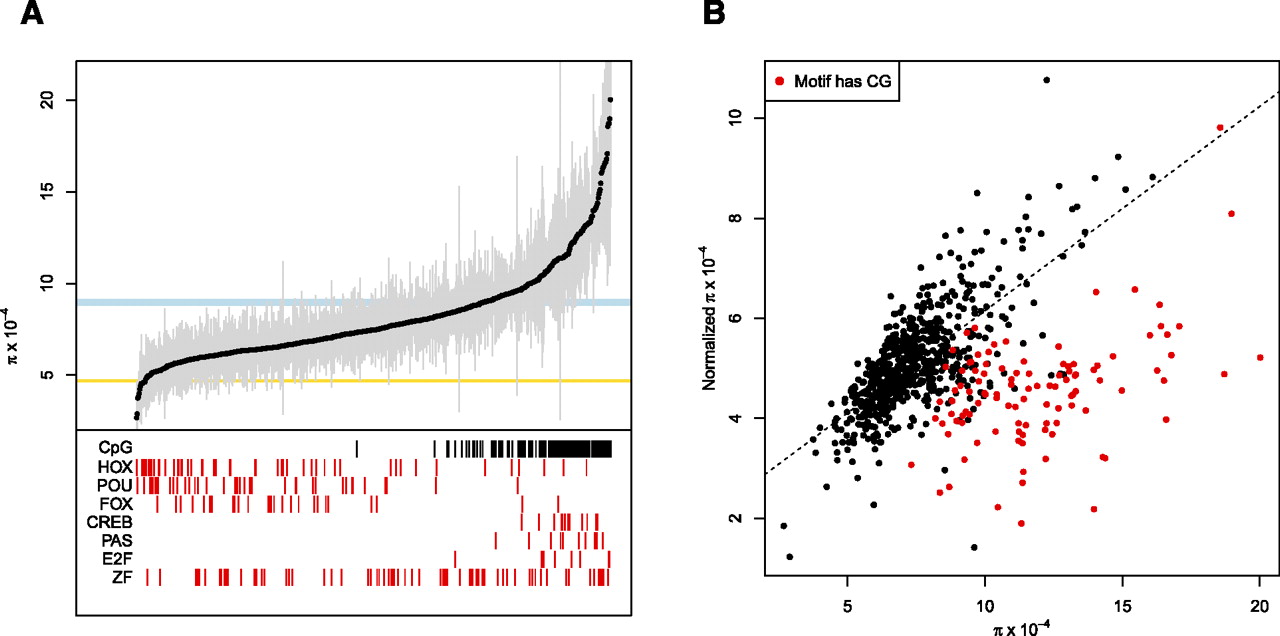
Significant variation of diversity between 732 cis-regulatory motifs. (A) For each motif, average diversity is plotted as a black circle, and 95% confidence intervals obtained by bootstrapping are shown as gray lines. The light blue and yellow rectangles denote the 95% confidence intervals of diversity in fourfold synonymous sites (FFSs) and the exome, respectively. (Red vertical lines) Motifs that belong to the indicated class of transcription factor. (Black vertical lines) Motifs where at least 50% of all instances of that motif contain a CpG dinucleotide. (B) Normalized diversity in motifs versus non-normalized diversity. Motifs with a CpG (defined as above) are plotted in red. (Dashed line) Best fit for non-CpG motifs (r = 0.70, P < 10−16).


