
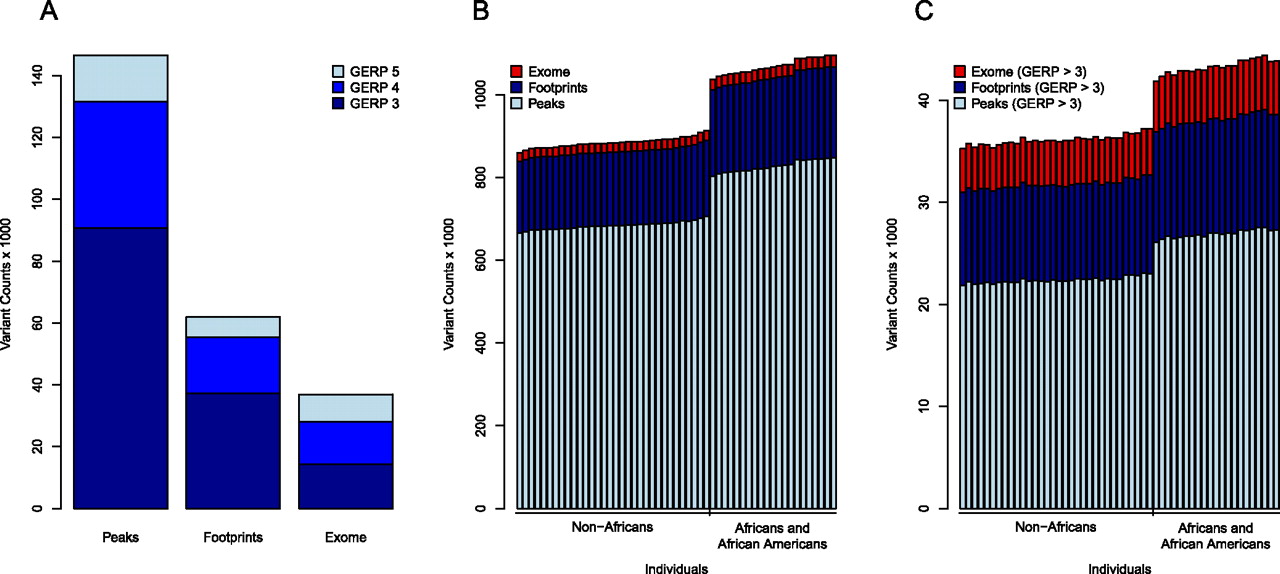
Figure 2.
Characteristics of regulatory variation among individuals. (A) Total number of variants in DNase I peaks, footprints, and the exome stratified by GERP score. (B) Distribution of the number of variants per individual in DNase I peaks, footprints, and the exome. (C) Distribution of the number of variants per individual with GERP ≥ 3 in DNase I peaks, footprints, and exomes.


