
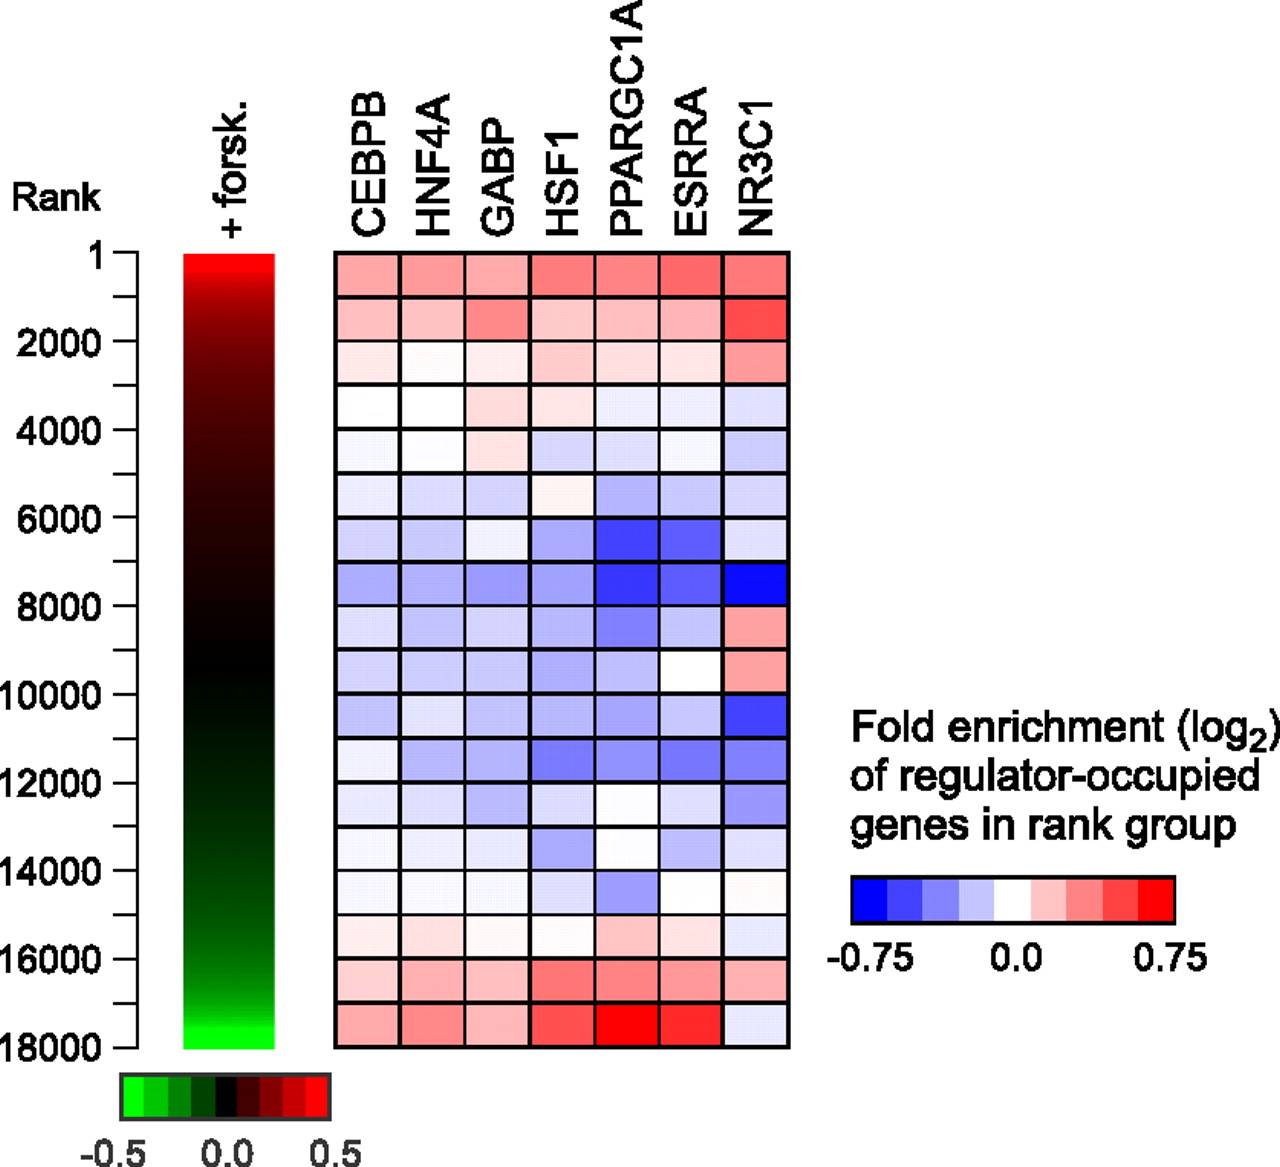
Regulator occupancy corresponds with gene expression changes in forskolin-treated HepG2 cells. (Left panel) Replicate gene expression measurements from Illumina BeadArrays were used to rank 18,000 genes by fold induction after 6 h treatment with forskolin. (Right panel) The distribution of regulator-occupied genes within the ranked list is depicted as a heatmap. The ranked list was divided into 18 rank groups containing 1000 genes each and genes containing 5′-proximal, 3′-proximal, or intragenic binding sites were identified for each factor. Within each rank group, the fraction of genes that are occupied by a given factor was compared with the fraction expected from a random distribution. Colors in the heatmap represent the level of over- or under-representation of regulator-occupied genes. Association of regulator-occupied genes with both the top and bottom of the ranked list was determined to be statistically significant (P < 10−3) for CEBPB, HNF4A, GABP, HSF1, PPARGC1A, and ESRRA using gene set enrichment analysis (Subramanian et al. 2005). NR3C1-occupied genes were significantly associated with the top of the ranked list only (P < 10−3).


