
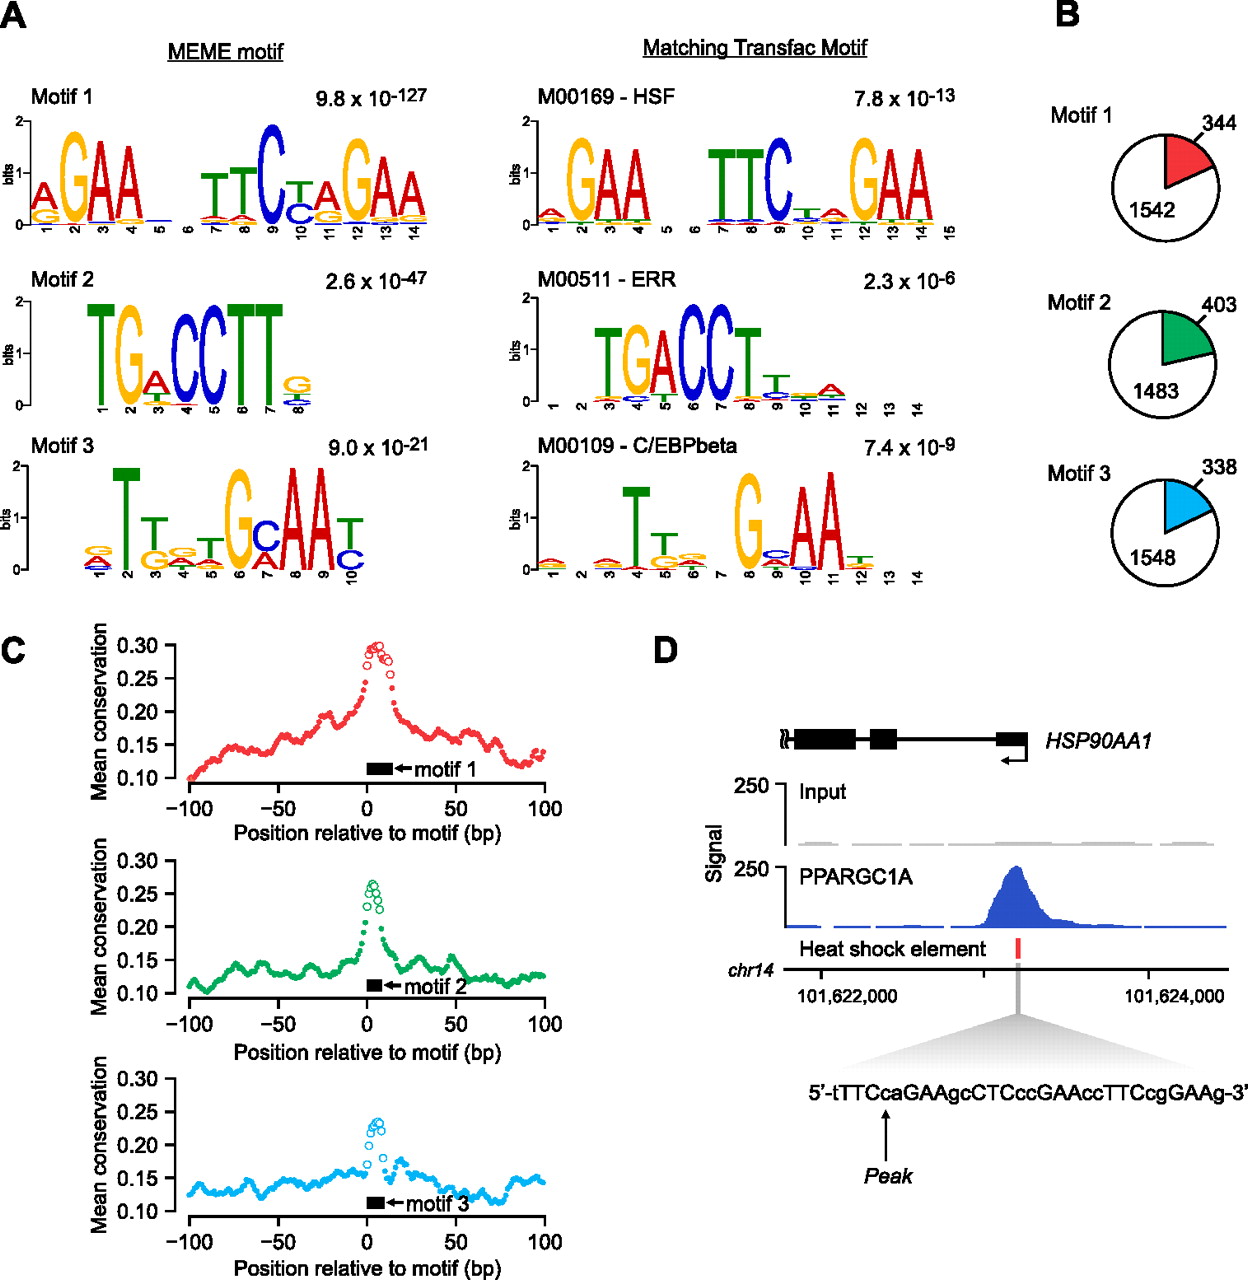
Discovery of enriched sequence motifs in PPARGC1A-occupied regions. (A) (Left panel) The top three DNA sequence motifs identified in an unbiased analysis of PPARGC1A-occupied regions using MEME. The MEME E-value, a measure of statistical significance (Bailey and Elkan 1994), is displayed above each motif. (Right panel) The most similar motif in the TRANSFAC database is displayed for each MEME motif (Matys et al. 2006). Comparison with the TRANSFAC database was performed using Tomtom (Gupta et al. 2007). The motif accession number and name from TRANSFAC and P-value from Tomtom are listed above each TRANSFAC motif. Motif logos were generated using the WebLogo tool (http://weblogo.berkeley.edu/). (B) The genomic DNA sequences of all PPARGC1A-occupied regions (±100 bp from each peak) were scanned for matches to each of the three motifs identified by MEME analysis. Colored wedges within each pie chart represent the fraction of all PPARGC1A binding sites that contain at least one match to the indicated DNA sequence motif. The number of regions in which a match is present or absent is indicated. Motif matches were identified using FIMO with a similarity P-value threshold of 0.01 (Bailey et al. 2009). (C) The mean phastCons conservation score (Siepel et al. 2005) across all motif-containing PPARGC1A binding sites is plotted in a 200-bp window centered on the start position of the motif. (Black boxes) Position of the corresponding motif. (Open circles) Points in each plot that correspond to base pairs constituting the motif. (D) PPARGC1A binds in close proximity to HSEs in a subset of occupied regions. A PPARGC1A binding site in the promoter of the HSP90AA1 gene is shown as an example. The genomic position of the HSE in the HSP90AA1 promoter is indicated as a red box beneath the PPARGC1A signal map. The sequence of the HSE, containing six inverted repeats of the consensus sequence nGAAn (Hickey et al. 1989; Mathur et al. 1994), is displayed in the expanded view. (X-axis) Chromosomal positions. Gene structure is shown to scale above the signal plot. (Arrow) Genomic coordinate of the PPARGC1A signal peak.


