
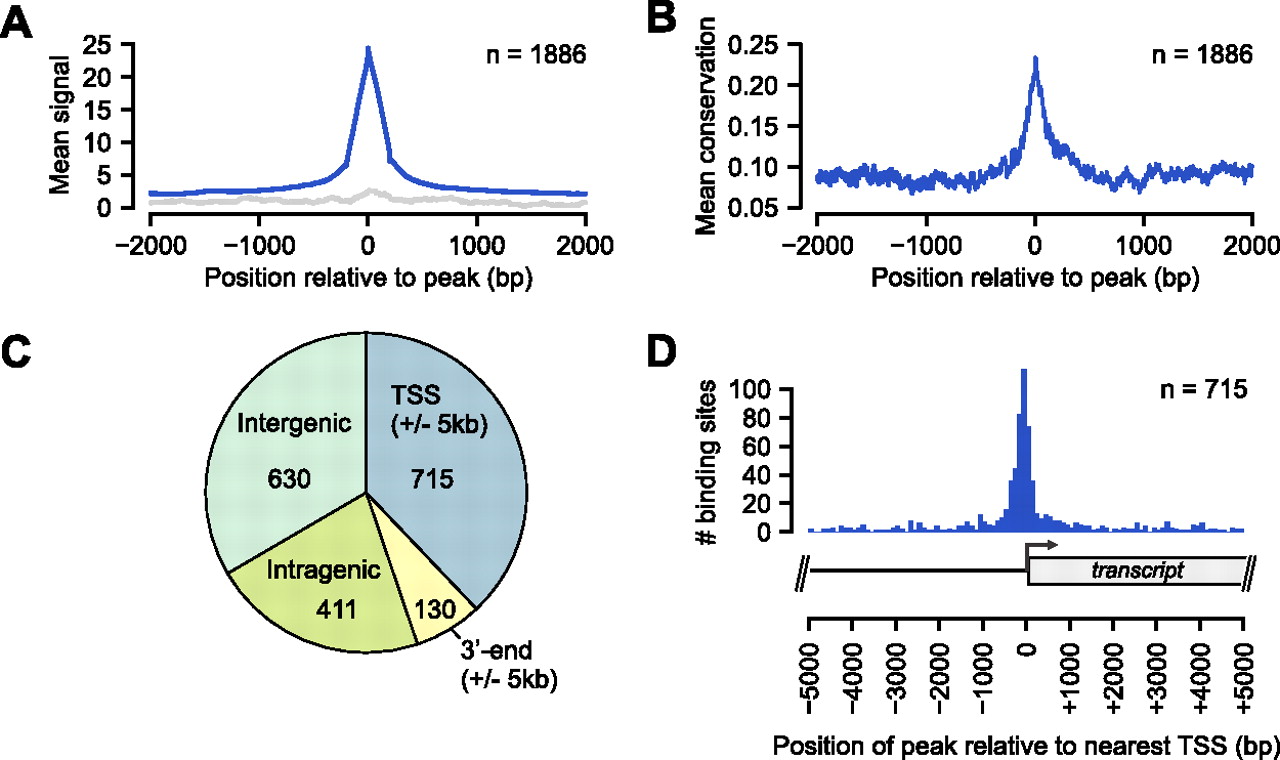
Genome-wide occupancy of PPARGC1A determined by ChIP-seq. (A) Plot of the mean PPARGC1A ChIP enrichment signal (blue) in the region spanning ±2 kb from the signal peak across all 1886 PPARGC1A-occupied regions. (Gray) Mean signals from input DNA in the same regions. (B) Plot of the mean phastCons conservation scores in the region spanning ±2 kb from the signal peak across all PPARGC1A-occupied regions. The phastCons conservation score (ranging from 0 to 1) represents the probability that a base is in a conserved element (Siepel et al. 2005). (C) Pie chart displaying the distribution of PPARGC1A binding sites relative to UCSC Known Genes transcript annotations (Hsu et al. 2006). Each PPARGC1A binding site was mapped to one of four annotation categories in the following order of preference: TSS (peak within 5 kb), 3′-end (peak within 5 kb), intragenic, intergenic. The total number of sites mapping to each category is displayed within the corresponding portion of the pie chart. (D) Distribution of all 715 TSS-associated PPARGC1A binding sites relative to the position of the nearest TSS. As demonstrated in the transcript diagram below the plot, binding positions are plotted with respect to the orientation of the associated transcript; negative positions indicate binding in the upstream region and positive positions indicate binding in the downstream region.


