
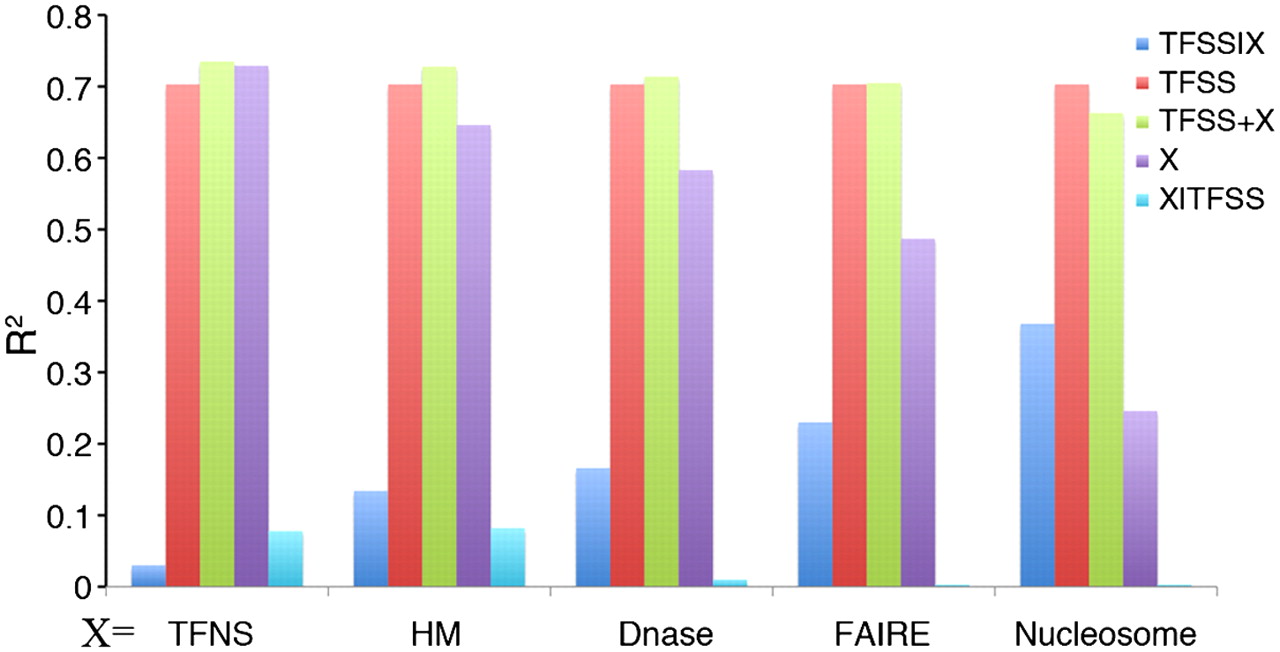
The relationship of the TFSS-binding data with five types of chromatin features for predicting promoter expression. For each type of chromatin feature, we constructed five models to calculate the fraction of variance of promoter expression levels explained by the TFSS alone (TFSS), by each feature alone (X), by a combination of TFSS and feature X (TFSS+X), as well as the additional variance explained by TFSS after taking feature X into account (TFSS|X) and vice versa (X|TFSS). Feature X represents general transcription factors (TFNS), histone modifications (HM), DNase signal, FAIRE signal, or nucleosome occupancy. CAGE expression data in Poly A+ RNA extracted from K562 whole cells were used in the calculation.


