
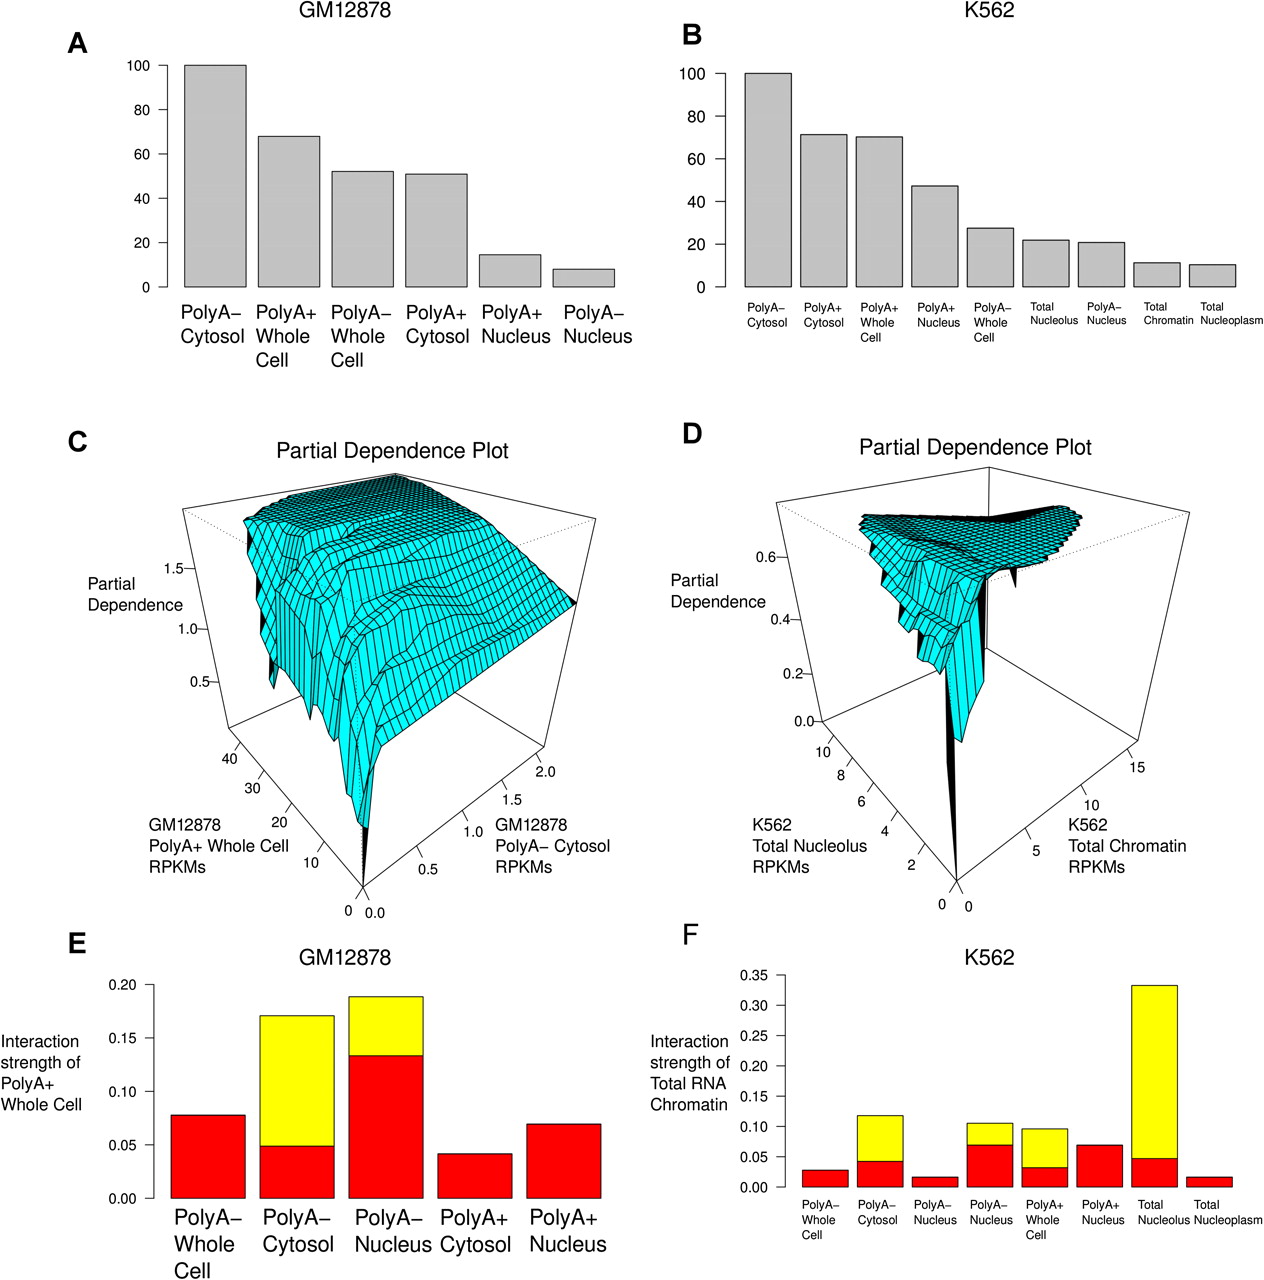
Visualizing some of the properties of the model of RNA-seq and MS/MS data. (A,B) Relative importance of each of the covariates (RNA fractions). (C) Relative partial dependence of the likelihood of detecting at least one uniquely mapping peptide on the polyA+ Whole Cell and polyA− Cytosol fractions from GM12878. This is known as a “partial dependence plot.” We note that detectable polyA− Cytosol expression is nearly a prerequisite to detecting uniquely mapping peptides, even when polyA+ Whole Cell expression is extremely high. (D) Partial dependence plot for the total RNA nucleolus and chromatin fractions from K562. (E,F) “Interaction strength plots.” These show the relative importance of considering the dependence between pairs of covariates (fractions) in the overall predictive model. (Red bars) Standard deviation under the null of no association.


