
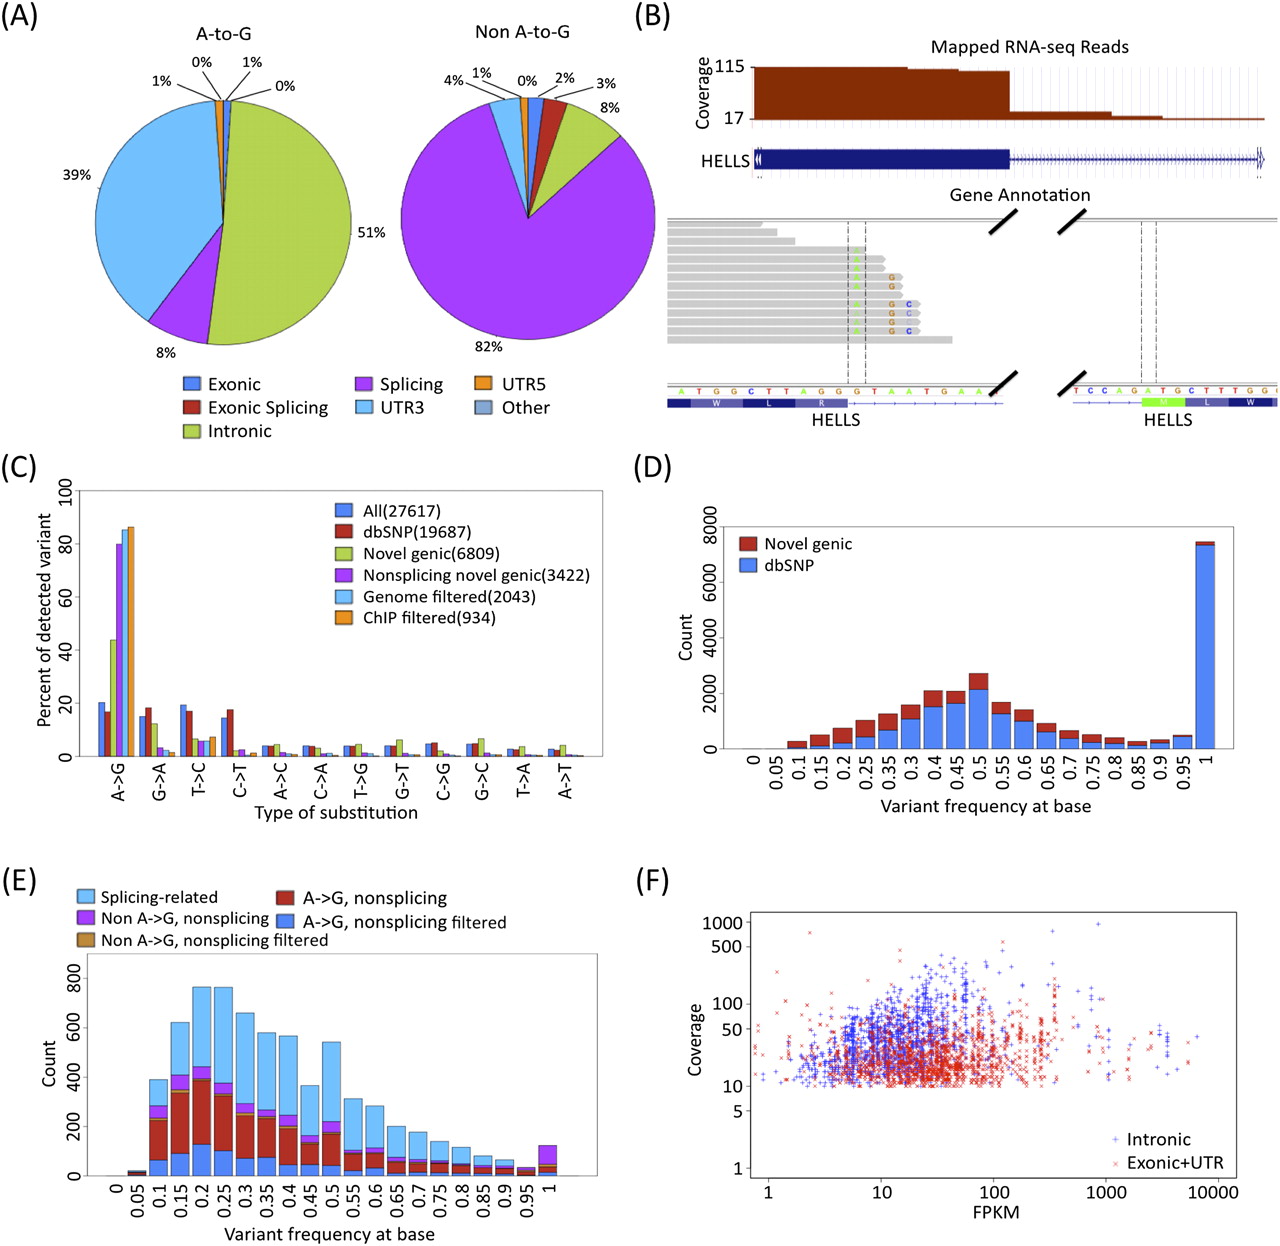
RNA editing calls in GM12878. (A) Most non–A-to-G SNVs are near splicing boundaries. The distribution relative to gene boundaries of A-to-G SNVs (left) versus non–A-to-G SNVs (right). (B) Example of reads mapped incorrectly across a known splice junction. Overhanging RNA-seq reads are mapped incorrectly into the intron when the correct position is in the adjacent exon, even though the splice junction was provided to the read mapper. (C) Distribution of SNVs at different steps in the pipeline. Prefiltered SNVs defined by having at least three nonidentical reads support the SNV, with a minimum SNV frequency of 10%, at least one edit per strand, and no more than one type of SNV for the same position in blue. SNVs annotated in dbSNP132 are red, SNVs that are not in dbSNP132 and within gene boundaries are green, SNVs that are not in dbSNP132 and within gene boundaries without splicing sites are purple, SNVs that had no matching 1000 Genome sequencing reads are in light blue, and SNVs passing ChIP filtering are in orange. (D) Frequency distribution of SNVs primarily reflects expression of homozygous and heterozygous SNPs. The SNVs that were found in dbSNP132 are in blue; the novel genic SNVs, red. (E) Most nonsplice adjoining SNPs are A-to-G. The nonsplicing novel genic A-to-G calls in filtered calls are in blue; nonsplicing novel genic A-to-G calls, red; nonsplicing novel genic non–A-to-G, brown; nonsplicing novel genic non–A-to-G in filtered calls, purple; and splicing-only novel genic, light blue. (F) Distribution of gene expression versus coverage of exonic sites are in red and intronic sites are in blue for genic SNVs. SNVs in more lowly expressed genes are primarily on exons, due to our minimum depth of coverage requirements.


