
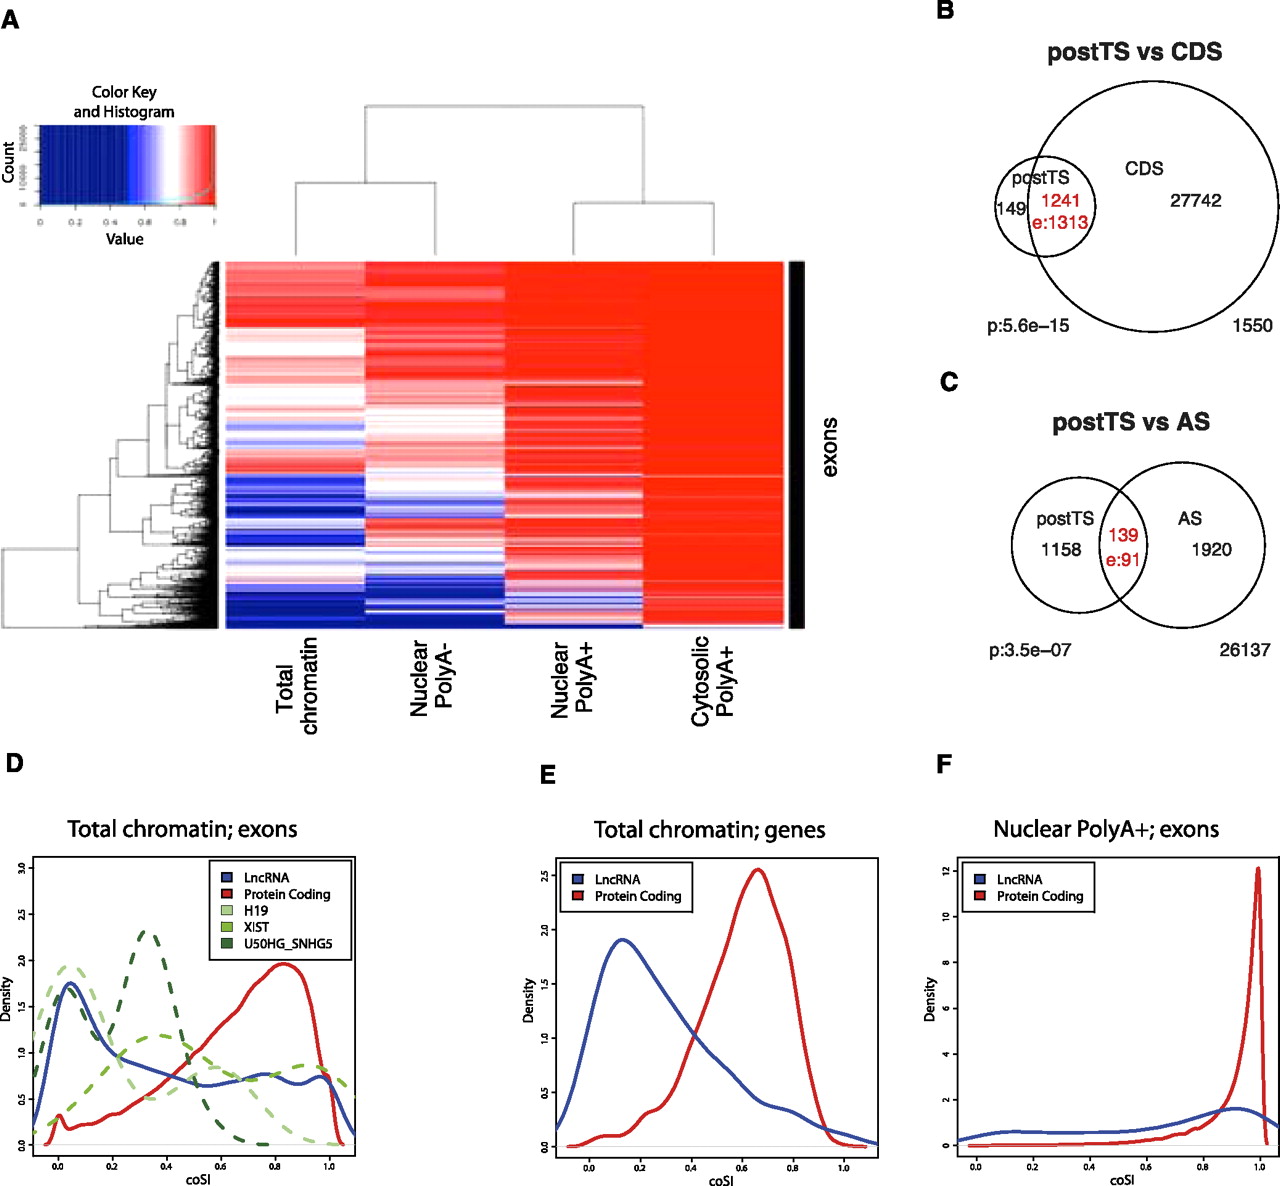
(A) Clustering of subcellular RNA fractions and exons according to exonic coSI values using four RNA fractions. From left to right: total chromatin-associated RNA, polyA− nuclear RNA, polyA+ nuclear RNA, polyA+ cytosolic RNA. Note that the scale is only linear from coSI ≥ 0.5 on. (B) Overlap between exons with a tendency for post-transcriptional splicing (postTS) and entirely coding exons (CDS). (C) Overlap between cell type specifically included AS-exons and exons with a tendency for postTS. (D) The distribution of coSI scores for various exon sets is shown, based on calculations for chromatin total RNA. Information is plotted for the 4933 lncRNA exons and 372,306 protein-coding gene exons that have sufficient RNA-seq reads to calculate a confident coSI score. In addition, we extracted exon values for three known lncRNAs: H19 (18 exons), XIST (19 exons), U50HG-SNHG5 (22 exons). The difference between lncRNA and protein exon coSI values is statistically significant (Wilcox test; P < 2.2 × 10⁻¹⁶). (E) Gene-level coSI scores from chromatin total RNA are plotted for 92 lncRNAs and 4066 protein-coding genes. The difference between the distributions is statistically significant (Wilcox test; P < 2.2 × 10⁻¹⁶). (F) Exon-level coSI scores from nuclear polyA+ RNA are plotted for 206 lncRNA exons and 32,496 protein-coding exons. The difference between the distributions is statistically significant (Wilcox test; P < 2 × 10⁻¹⁶).


